
Figure 2.
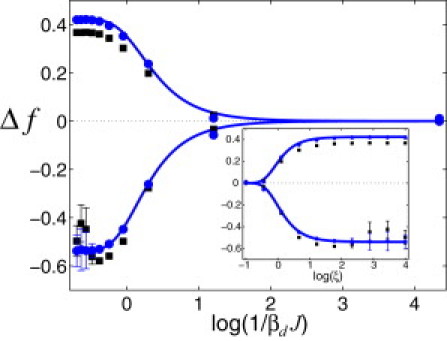
TF-DNA binding free-energy difference normalized per basepair, , computed using Eq. 7 as a function of the reduced design temperature, (solid curves). The upper and lower branches of the graph correspond to (antiferromagneticlike DNA sequence correlations) and (ferromagneticlike correlations), respectively. The results of MC simulations of the system are in excellent agreement with the analytical results (solid circles). We used the parameters , , and . In Monte Carlo simulations, we used 7.5 × 10⁶ MC moves to design each DNA sequence at each value of Td. To generate each point in the plot, we used a set of 100 sequences. To compute error bars, we divided each set of 100 sequences randomly into 10 subsets, and then calculated the SD of the subset averages for . The error bars correspond to 1 SD. The numerically computed quenched average, , is also shown (solid squares). In the computations, we used the same parameters and definitions as specified above. (Inset) Same data for as in the main figure, but plotted as a function of ξ.