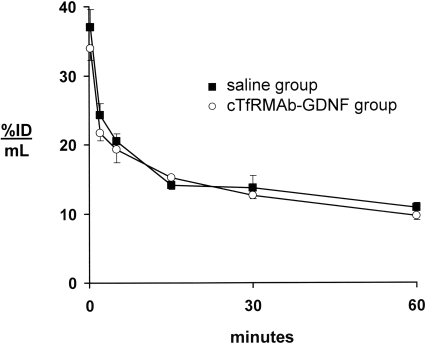
Fig. 4.
Plasma concentration, expressed as percentage of ID per milliliter, of the [3H]cTfRMAb-GDNF fusion protein after intravenous injection in mice from either the saline treatment group or the cTfRMAb-GDNF fusion protein group. Males and females are combined, because there were no differences between sexes. Data are means ± S.E. (n = 4 mice/point).

