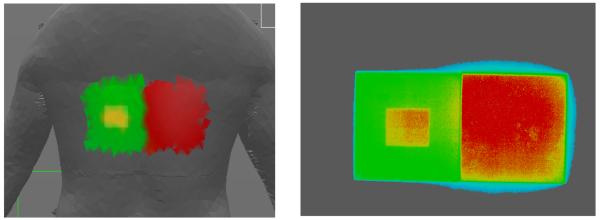
Figure 8.
Comparison of dose distribution provided on DTS graphic (left) with that recorded on Gafchromic film (right). The density values of the Gafchromic film were color-converted using a calibration curve and the color bar on the DTS graphic.The blue outline is likely due to penumbra and scatter outside the main beam that is not included on the patient graphic.

