Abstract
Objective
To assess different countries’ chances of attaining the 2011–2015 global leprosy target set by the World Health Organization (WHO) and to assess the strategy’s effect on the prevalence of grade 2 disability (G2D).
Methods
Trends in G2D rate were analysed for Brazil, China, India and Thailand and figures were compared with the WHO target: a 35% decrease by 2015 relative to the 2010 baseline. To estimate the prevalence of G2D in 2015 and 2035 for each country three assumptions were made: (i) maintenance of the current trend; (ii) attainment of the WHO target, and (iii) reduction of G2D by 50% every 5 years relative to 2010.
Findings
Since 1995, the G2D rate has decreased every 5 years in Brazil, China, India and Thailand by 12.7% (95% confidence interval, CI: 6.6–18.3), 7.7% (95% CI: 1.1–12.8), 53.7% (95% CI: 38.1–65.4) and 35.9% (95% CI: 23.4–46.3), respectively. New cases with G2D detected after 2010 will contribute 15% (Brazil), 3% (China), 2.5% (India) and 4% (Thailand) to the total prevalence of G2D in 2015. If no policies are changed, between 2015 and 2035, the prevalence of G2D will decrease by more than half in China, India and Thailand, and by 16% in Brazil.
Conclusion
The implications of attaining the WHO target are different for each country and using indicators other than G2D prevalence will help monitor progress. The strategy will not immediately reduce the prevalence of G2D, but if it is applied consistently over the next 25 years, its long-term effect can be substantial.
Résumé
Objectif
Évaluer la probabilité pour différents pays d’atteindre l'objectif global 2011–2015 contre la lèpre, défini par l’Organisation mondiale de la Santé (OMS) et évaluer l’effet de la stratégie sur la prévalence de l’invalidité de catégorie 2 (IC2).
Méthodes
Les tendances du taux IC2 ont été analysées pour le Brésil, la Chine, l’Inde et la Thaïlande, et les chiffres ont été comparés avec l'objectif de l’OMS: d’ici 2015, une diminution de 35% est prévue par rapport à la base de 2010. Pour estimer la prévalence de l’IC2 en 2015 et en 2035 pour chaque pays, trois suppositions ont été faites: (i) le maintien de la tendance actuelle, (ii) la réalisation de l'objectif de l’OMS, et (iii) la réduction de l’IC2 de 50% tous les 5 ans par rapport à 2010.
Résultats
Depuis 1995, le taux de l’IC2 a diminué de 12,7% tous les 5 ans au Brésil, en Chine, en Inde et en Thaïlande (intervalle de confiance de 95%, IC: 6,6–18,3), 7,7% (95% IC: 1,1–12,8), 53,7% (95% IC: 38,1–65,4) et 35,9% (95% IC: 23,4–46,3), respectivement. Les nouveaux cas avec l’IC2 détectée après 2010 contribueront à hauteur de 15% (Brésil), 3% (Chine), 2,5% (Inde) et 4% (Thaïlande) de la prévalence totale de l’IC2 en 2015. Si aucune politique n’est modifiée, entre 2015 et 2035, la prévalence de l’IC2 diminuera de plus de la moitié en Chine, en Inde et en Thaïlande, et de 16% au Brésil.
Conclusion
Les implications liées à la réalisation de l'objectif de l’OMS sont différentes pour chaque pays et l’utilisation d’indicateurs autres que la prévalence de l’IC2 permettront de contrôler la progression. La stratégie ne réduira pas immédiatement la prévalence de l’IC2, mais si elle est appliquée de façon cohérente au cours des 25 prochaines années, son effet à long terme pourra être considérable.
Resumen
Objetivo
Evaluar las posibilidades de diversos países de alcanzar el objetivo mundial de la lucha contra la lepra para 2011–2015 establecido por la Organización Mundial de la Salud (OMS) y evaluar el efecto de dicha estrategia en la prevalencia de la discapacidad de grado 2 (DG2).
Métodos
Se analizaron las tendencias en la tasa de DG2 en Brasil, China, India y Tailandia y se compararon las cifras con el objetivo de la OMS: un descenso del 35% para 2015 en comparación con los valores iniciales de 2010. Con el fin de calcular la prevalencia en cada país de la DG2 en 2015 y 2035 se establecieron tres supuestos: (a) mantenimiento de la tendencia actual; (b) consecución del objetivo de la OMS; y (c) reducción de la DG2 en un 50% cada 5 años en comparación con el 2010.
Resultados
Desde el año 1995, la tasa de DG2 ha descendido cada 5 años en Brasil, China, India y Tailandia en un 12,7% (intervalo de confianza del 95%, IC: 6,6–18,3), 7,7% (IC del 95%: 1,1–12,8), 53,7% (IC del 95%: 38,1–65,4) y un 35,9% (IC del 95%: 23,4–46,3), respectivamente. Los nuevos casos de DG2 detectados después del año 2010 contribuirán en un 15% (Brasil), un 3% (China), un 2,5% (India) y un 4% (Tailandia) a la prevalencia total de dicha tasa en 2015. Entre 2015 y 2035, la prevalencia de la DG2 disminuirá más de la mitad en China, India y Tailandia, y un 16% en Brasil, si no se cambian las políticas.
Conclusión
Las implicaciones de la consecución del objetivo de la OMS son distintas para cada país, y la utilización de indicadores distintos de la prevalencia DG2 ayudará a controlar dicho progreso. La estrategia no reducirá de inmediato la prevalencia de la DG2 aunque, si se aplica con regularidad durante los próximos 25 años, su efecto a largo plazo podría ser considerable.
Резюме
Цель
Исследовать шансы различных стран на достижение глобального целевого показателя по лепре, установленного Всемирной организацией здравоохранения на период 2011–2015 годов, и оценить воздействие этой стратегии на распространенность второго уровня инвалидности (УИ2).
Методы
Были проанализированы тенденции в отношении показателя УИ2 для Бразилии, Индии, Китая и Таиланда, а цифры были сопоставлены с целевым показателем ВОЗ: снижением на 35% к 2015 году, по сравнению с базовым показателем 2010 года. Для оценки распространенности УИ2 в каждой стране в 2015 и 2035 годах были сделаны три предположения: (i) сохранение существующей тенденции; (ii) достижение целевого показателя ВОЗ; и (iii) снижение УИ2 на 50% каждые пять лет, по сравнению с 2010 годом.
Результаты
С 1995 года в Бразилии, Индии, Китае и Таиланде показатель УИ2 снижался каждые пять лет на 12,7% (95% доверительный интервал, ДИ: 6,6–18,3), 53.7% (95% ДИ: 38,1–65,4), 7,7% (95% ДИ: 1,1–12,8), и 35,9% (95% ДИ: 23,4–46,3), соответственно. В 2015 году доля новых случаев наступления УИ2, выявленных после 2010 года, будут составлять 15 (Бразилия), 2,5 (Индия), 3 (Китай) и 4% (Таиланд) от общего показателя распространенности. Если применяемые политические меры не изменятся, то в период между 2015 и 2035 годами распространенность УИ2 в Индии, Китае и Таиланде уменьшится более чем на половину, а в Бразилии до 16%.
Вывод
Для каждой страны последствия достижения целевого показателя ВОЗ различны, а для мониторинга прогресса потребуется использовать не УИ2, а другие показатели. Осуществление стратегии не приведет к непосредственному сокращению распространенности УИ2, но если последовательно применять ее в течение предстоящих 25 лет, то ее долгосрочное воздействие будет значительным.
ملخص
الغرض
تقييم الفرص المتاحة أمام البلدان المختلفة لتحقيق أهداف الاستراتيجية العالمية لمكافحة الجذام للأعوام 2011-2015، والتي وضعتها منظمة الصحة العالمية، وتقييم تأثير هذه الاستراتيجية على انتشار الدرجة الثانية من العجز.
الطريقة
جرى تحليل اتجاهات الدرجة الثانية من العجز في البرازيل، والصين، والهند، وتايلاند، وقورنت الأرقام مع أهداف منظمة الصحة العالمية والمتمثلة في: تحقيق انخفاض قدره 35% بحلول عام 2015 مقارنة بالمستوى القاعدي في عام 2010. ولتقدير انتشار الدرجة الثانية من العجز في عامي 2015 و 2035 لكل بلد وضعت ثلاث فرضيات هي: 1) استمرار الاتجاه الحالي؛ 2) تحقيق أهداف منظمة الصحة العالمية؛ 3) الحد من الدرجة الثانية من العجز بمقدار 50% كل خمس سنوات مقارنة بالمستوى في عام 2010.
النتائج
منذ عام 1995، انخفض معدل الدرجة الثانية من العجز كل خمس سنوات في البرازيل، والصين، والهند، وتايلاند بمقدار 12.7% (فاصلة الثقة 95%: 6.6-18.3)، و 7.7% (فاصلة الثقة 95%: 1.1-12.8)، و 53.7% (فاصلة الثقة 95%: 38.1-65.4)، و 35.9% (فاصلة الثقة 95%: 23.4-46.3) على التوالي. وستشكل بعد عام 2010 الحالات الجديدة المكتشفة من الدرجة الثانية من العجز 15% (البرازيل)، 3% (الصين)، 2.5% (الهند)، 4% (تايلاند) من إجمالي انتشار الدرجة الثانية من العجز بين عام 2015 وعام 2035، وسيقل انتشار الدرجة الثانية من العجز إلى أقل من النصف في الصين، والهند، وتايلاند، وبمقدار 16% في البرازيل.
الاستنتاج
تختلف تأثيرات تطبيق أهداف منظمة الصحة العالمية في كل بلد، وسيساعد استخدام مؤشرات غير انتشار الدرجة الثانية من العجز في رصد التقدم المحرز. ولن تقلل الاستراتيجية على الفور من انتشار الدرجة الثانية من العجز، ولكن إذا استمر تطبيقها طوال الخمس وعشرين سنة القادمة، سيكون تأثيرها على الأمد الطويل تأثيراً عظيماً.
摘要
目的
旨在评估不同国家实现世界卫生组织(WHO)制定的2011-2015全球麻风病目标的机会,以及该战略对2级残疾(G2D)患病率的影响。
方法
分析了巴西、中国、印度和泰国的2级残疾率趋势,并将相关数据与世界卫生组织的目标-到2015年在2010年基础上降低35%-进行了对比。在评估各个国家2015年和2035年2级残疾的患病率时,做了三个假设:(i)维持目前的趋势;(ii)实现世界卫生组织的目标,以及(iii)相对于2010年而言,2级残疾每5年降低50%。
结果
自1995年起,巴西、中国、印度和泰国的2级残疾率每5年分别下降12.7%(95%可信区间:6.6-18.3)、7.7%(95%可信区间:1.1-12.8)、53.7%(95%可信区间:38.1-65.4)和35.9%(95%可信区间:23.4-46.3)。巴西、中国、印度和泰国2010年后检测出的2级残疾新病例在2015年2级残疾总患病率中占的比例分别为15%、3%、2.5%和4%。若现行政策未发生变化,在2015年到2035年间,中国、印度和泰国的2级残疾患病率将降低一半多,而巴西则为16%。
结论
各个国家实现世界卫生组织目标的可能性不同,采用2级残疾患病率以外的指标将有助于监控进展情况。该战略不会立即降低2级残疾的患病率,但若在今后25年连贯实施,则会产生重大的长期影响。
Introduction
Among communicable diseases, leprosy remains a leading cause of peripheral neuropathy and disability in the world, despite extensive efforts to reduce the disease burden.1 The success of multidrug therapy, introduced in 1981, encouraged the World Health Assembly to strive to eliminate leprosy – i.e. reduce its global prevalence to 1 case per 10 000 population – by the year 2000. However, the use of disease prevalence as a progress indicator was criticized. Disease prevalence, defined as the number of patients diagnosed with leprosy and registered for treatment over the course of a year,2 is very sensitive to factors such as treatment duration and case-finding method.3,4 As a result, alternative indicators such as the fraction of people with leprosy who have grade 2 disability (G2D) have been suggested to monitor the results of leprosy control activities.
In 2009, the World Health Organization (WHO) launched the Enhanced Global Strategy for Further Reducing the Disease Burden due to Leprosy for 2011–2015, under which the target became to reduce the number of new cases of leprosy with G2D per 100 000 total population (G2DR) by at least 35% between the end of 2010 and the end of 2015. G2D has been proposed as an indicator instead of leprosy prevalence because it is less susceptible to operational factors such as detection delay and is a more robust marker for mapping cases of leprosy in a country. WHO expects that by using G2D as an indicator and by focusing interventions on reducing G2D, delayed detection and treatment of leprosy patients will also be reduced and so will the number of new leprosy cases in the population.5
The aim of reducing the G2DR by 35% over 5 years has led us to ask important questions. First, if a given country currently shows a particular trend in leprosy-related G2D, how far is that country from reaching the WHO target? Second, how will this new target affect the absolute number of individuals living with G2D caused by leprosy? We also investigate the effect of modifying this strategy in two ways: by extending the target date until 2035 and by seeking a 50% instead of a 35% reduction in G2DR. This type of analysis may enable policy-makers to steer their programmes towards achieving optimal results in reducing the burden of leprosy in the coming years.
Methods
Definition of disability grade
The WHO leprosy disability grading system has changed over the years. The system currently in use is described in Box 1,6 which grades leprosy patients according to disabilities of the eyes, hands and feet. The highest grade of disability of any of these body sites is used as an overall indicator of the disability status of a person with leprosy. Leprosy-related G2D can be reported in different ways: as G2DN (absolute number of people with G2D among leprosy cases newly diagnosed in a specific year); as G2D% (proportion of people with G2D among leprosy cases newly diagnosed in a specific year); as G2DR (newly diagnosed leprosy patients with G2D in a given year divided by that year’s population at mid-year and multiplied by 100 000); and as G2D prevalence (absolute number of individuals ever diagnosed with leprosy and living with G2D in a specific year).
Box 1. WHO grading system.
Hands and feet
Grade 0 No anaesthesia, no visible deformity or damage
Grade 1 Anaesthesia present, but no visible deformity or damage
Grade 2 Visible deformity or damage present
Eyes
Grade 0 No eye problem due to leprosy; no evidence of visual loss
Grade 1 Eye problems due to leprosy present, but vision not severely affected as a result (vision: 6/60 or better; can count fingers at 6 metres).
Grade 2 Severe visual impairment (vision worse than 6/60; inability to count fingers at 6 metres); also includes lagophthalmos, iridocyclitis and corneal opacities.
Source: Table adapted from Brandsma et al.6
Selection of countries
For this study we selected four countries with endemic leprosy in different phases of the leprosy epidemic and for which reasonably consistent data were available over a long period: Brazil, because it has the highest G2DR; China, because it has the highest G2D%; India, because it has the highest G2D prevalence; and Thailand, because it is known to have a long-standing, reliable leprosy prevention programme. These countries can serve as models for other countries with similar profiles.
Data collection
For the four selected countries we collected data on the annual number of new leprosy cases with and without G2D (data available from the corresponding author on request). Data on all countries, except for Brazil and China during certain periods, came from WHO documents presented at an informal consultation in 2009.7 For Thailand, India and Brazil we used G2D data reported by WHO beginning in 1982, 1985 and 1987, respectively. For China we used data on G2D% from 1945 onwards from a recent article,8 complemented with WHO data for 1999–2008. For Brazil we obtained data for 2001–2009 from the Sinanweb.9 To calculate the G2DR we used the mid-year population of each country as reported by the US Census Bureau.10 The four countries we examined apply comparable definitions of “non-communicable disease” and “grade 2 disability” because they adhere to WHO guidelines. We also obtained data on non-communicable diseases and G2D from WHO data sources. Because little information exists on the age distribution of G2D cases, we used the best available data for each country.
For all countries we applied the age-specific death rates of the general population to individuals affected by leprosy. Death rates among people affected by leprosy are hard to find because leprosy is rarely the immediate cause of death.1 We therefore assumed that leprosy patients die at the same rates as individuals in the general population.
Trend analysis for 2010–2015
For each country we examined the current trend in G2DR in two ways: (i) by analysing all data available (complete data set fit) and (ii) by analysing data only for the period since 1995 (1995 fit). To do this we used a basic exponential function since the general trend observed showed an exponential decline. We analysed the period beginning in 1995 on the assumption that data for the most recent years are the most reliable and because global coverage with multidrug therapy surpassed 90% in 1995. For China and Thailand we excluded data before 1957 and 1981, respectively, because they were not consistent with the general trends observed. For Brazil we excluded data for 2007–2008 because the web site states that they were compromised for technical reasons.11 For each fit we provide R2 as a measure of the goodness of fit. These calculations were implemented in MatLab version 7.5 (R2007b) (MathWorks Inc., Natick, United States of America).
Prevalence of grade-2 disability
We calculated the prevalence of G2D for 2015 and 2035 to estimate the effect of the WHO target on the absolute number of leprosy patients with G2D. For this purpose we defined prevalence not as the number of leprosy patients under treatment, but, as indicated earlier, as the absolute number of leprosy patients with G2D in a specific year. We analysed three alternatives to the WHO policy: (i) suspending the WHO policy in 2015; (ii) sustaining the policy until 2035; and (iii) defining the target as a decrease of 50% instead of 35% every 5 years. We analysed the third possibility to explore the effect of a decrease substantially larger than the one set by WHO. We used a model developed by Meima et al.12 to make these calculations, which we implemented in an Excel spreadsheet (Microsoft, Redmond, USA).
The model predicts the absolute number of individuals living with G2D up to a specific year. First we determined the incidence of G2D by calendar year (step 1) and then, using the age distribution, we assigned an age to every individual detected each year (step 2). From this assigned age we calculated until what year each individual would survive (step 3). Finally, to obtain the prevalence of G2D we added the number of surviving individuals with G2D in 2015 and 2035 (step 4). Each step is described in detail below.
Incidence of grade 2 disability (step 1)
We determined the incidence of G2D by calendar year. Because information for all years was not available, we estimated the incidence for the missing years. For the period before the first available data point we applied backward extrapolation.12 For the period starting from the last available data point up to 2010 we used the 1995 fit, as described in the previous section. For the period after 2010 we developed three scenarios: (i) the country sustained the current trend (1995 fit), (ii) the country attained the WHO target of a 35% decline every 5 years, and (iii) the country attained a decline of 50% every 5 years. For the last two scenarios we assumed exponential declines, which equate to an annual decline of 1 − 0.651/5 = 0.083, or 8.3%, and 1 − 0.51/5 = 0.129, or 12.9%, respectively.
Subsequently we characterized three cohorts: individuals with G2D detected before the global introduction of multidrug therapy (1980 or earlier); individuals detected during the period ranging from the year in which multidrug therapy was introduced to the start of the target period (1981–2009); and those detected from 2010 up to 2015 and up to 2035. This clarified the contribution of each period to the future prevalence of G2D.
Age-specific incidence of grade 2 disability (step 2)
To determine the incidence of G2D at age a in calendar year k, we used a method analogous to Meima et al.’s and subjected the total incidence of G2D in year k to the age distribution of all newly-detected cases of leprosy with grade2 disability.12
For Brazil we used the age distribution of G2D as reported by the Sinanweb,7 which gives the age of each case of leprosy with G2D diagnosed during 2001–2009 for the whole country.8 We had no information of the age-distribution of G2D for the other three countries, so we used the age-distribution of non-communicable diseases instead. For China we used the age distribution of the new leprosy cases detected in Jiangxi the province in 2000–2009 (Lamei Wang, personal communication). For Thailand we used the age distribution of the new leprosy cases detected in the general population for 2002–2008.13 For India we used the age distribution of G2D as reported for Brazil because we were not aware of any published data on the age distribution of G2D or non-communicable diseases in the general population in India. (All data are available from the corresponding author on request.)
Survival analysis (step 3)
In this step we calculate the number of leprosy survivors with G2D up to 2015 and 2035. In step 2 we estimated the age of each individual in calendar year k; we used the age-specific death rate to calculate the fraction of these individuals with age a in calendar year k who would survive until year k + 1. By repeating this step several times, we calculated the number of survivors in 2015 and 2035. The oldest age considered in this study was 100 years. To perform these calculations we used a life table of the general population (provided by WHO)14 to derive the age-specific death rate for each country, and we assumed that these death rates were applicable to individuals with grade 2 disability. WHO provides life tables for 1990, 2000 and 2008, and we used the life table for the year 2000.
Results
Analysis of trends in G2DR for 2010–2015 (Part I)
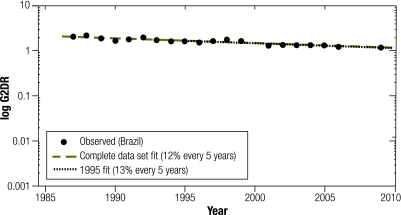
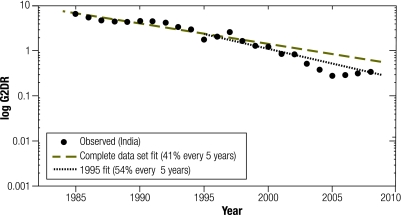
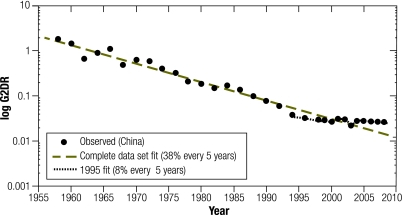
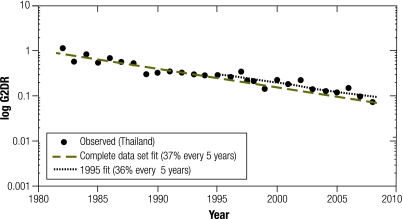
We represent the trend as we expected it to be in 2010–2015 in Fig. 1, Fig. 2, Fig. 3 and Fig. 4. We show two trends: one based on all the data points available (complete data set fit), and another based on the data since 1995 (1995 fit).
Fig. 1.
Leprosy cases with World Health Organization grade 2 disability per 100 000 population (G2DR) for Brazil represented on a logarithmic scale, per year
G2DR, newly diagnosed leprosy patients with G2D in a given year divided by that year’s population at mid-year and multiplied by 100 000.
The observed values for each country are symbolized with black circles. Trend estimates for the complete data set are represented with grey dashed lines, and for the period from 1995 onwards with black dotted lines.
Fig. 2.
Leprosy cases with World Health Organization grade 2 disability per 100 000 population (G2DR) for China represented on a logarithmic scale, per year
G2DR, newly diagnosed leprosy patients with G2D in a given year divided by that year’s population at mid-year and multiplied by 100 000.
The observed values for each country are symbolized with black circles. Trend estimates for the complete data set are represented with grey dashed lines, and for the period from 1995 onwards with black dotted lines.
Fig. 3.
Leprosy cases with World Health Organization grade 2 disability per 100 000 population (G2DR) for India represented on a logarithmic scale, per year
G2DR, newly diagnosed leprosy patients with G2D in a given year divided by that year’s population at mid-year and multiplied by 100 000.
The observed values for each country are symbolized with black circles. Trend estimates for the complete data set are represented with grey dashed lines, and for the period from 1995 onwards with black dotted lines.
Fig. 4.
Leprosy cases with World Health Organization grade 2 disability per 100 000 population (G2DR) for Thailand represented on a logarithmic scale, per year
G2DR, newly diagnosed leprosy patients with G2D in a given year divided by that year’s population at mid-year and multiplied by 100 000.
The observed values for each country are symbolized with black circles. Trend estimates for the complete data set are represented with grey dashed lines, and for the period from 1995 onwards with black dotted lines.
For Brazil (Fig. 1) we observed a decrease of 11.9% (95% confidence interval, CI: 9.3–14.5) every 5 years (2.5% annually) when we used the complete data set fit, and of 12.7% (95% CI: 6.6–18.3) every 5 years (2.7% annually) when we used the 1995 fit. Thus, the decreasing trend observed was slower than the WHO target of 35% every 5 years. R2 for the complete data set fit (1987–2009) and for the 1995 fit (1995–2009) was 0.83 and 0.65, respectively. For China (Fig. 2) we observed a decrease of 37.8% (95% CI: 32.8–42.4) every 5 years (9.1% annually) when we used the complete data set fit (R2 = 0.93), and of 7.7% (95% CI: 1.1–12.8) every 5 years when we used the 1995 fit. China’s attainment of the WHO target would depend on the fit used. For India (Fig. 3) we observed a decrease of 40.6% (95% CI: 35.6–45.3) every 5 years (9.9% annually) when we used the complete data set fit (R2 = 0.93), and a decrease of 53.7% (95% CI: 38.1–65.4) every 5 years (14.3% annually) when we used the 1995 fit (R2 = 0.96). Regardless of the projection used, India showed a decrease of more than 35% every 5 years. Finally, for Thailand (Fig. 4) both the complete data set fit (R2 = 0.86) and the 1995 fit (R2 = 0.73) showed a decrease of close to 35% every 5 years: 37.3% (95% CI: 31.4–42.8) (8.9% annually) and 35.9% (95% CI: 23.4–46.3) (8.5% annually), respectively.
Prevalence of grade 2 disability (Part II)
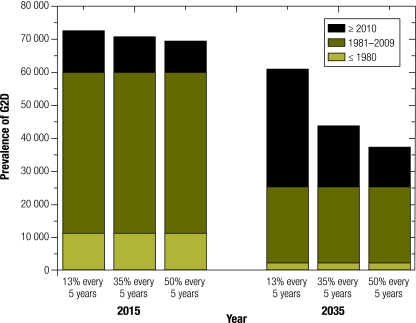
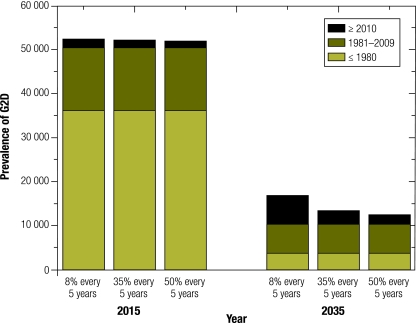
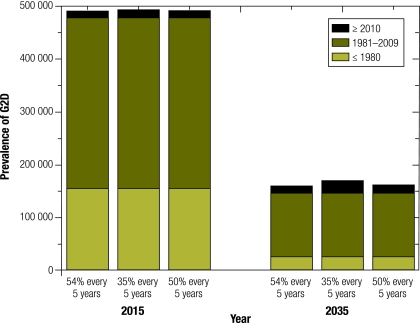
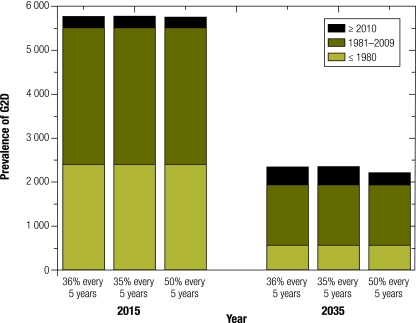
The estimated prevalence of G2D in 2015 and 2035 is shown for Brazil in Fig. 5, for China in Fig. 6, for India in Fig. 7 and Thailand in Fig. 8. The estimated prevalence is based on three scenarios: sustainment of the current trend (1995 fit), attainment of the WHO target, and attainment of a 50% decline every 5 years. The prevalence was calculated for three cohorts: individuals detected in 1980 or before, those detected in 1981–2009, and those detected from 2010 to 2015 and to 2035, respectively.
Fig. 5.
Estimated prevalence of World Health Organization grade 2 disability (G2D) in Brazil in 2015 and 2035 under three scenariosa
a The three scenarios are: (i) the observed trend in G2DR continues (reported as a rounded percentage); (ii) the WHO target (a decline of 35% every 5 years) is attained, and (iii) a decline of 50% every 5 years is attained.
Fig. 6.
Estimated prevalence of World Health Organization grade 2 disability (G2D) in China in 2015 and 2035 under three scenariosa
a The three scenarios are: (i) the observed trend in G2DR continues (reported as a rounded percentage); (ii) the WHO target (a decline of 35% every 5 years) is attained, and (iii) a decline of 50% every 5 years is attained.
Fig. 7.
Estimated prevalence of World Health Organization grade 2 disability (G2D) in India in 2015 and 2035 under three scenariosa
a The three scenarios are: (i) the observed trend in G2DR continues (reported as a rounded percentage); (ii) the WHO target (a decline of 35% every 5 years) is attained, and (iii) a decline of 50% every 5 years is attained.
Fig. 8.
Estimated prevalence of World Health Organization grade 2 disability (G2D) in Thailand in 2015 and 2035 under three scenariosa
a The three scenarios are: (i) the observed trend in G2DR continues (reported as a rounded percentage); (ii) the WHO target (a decline of 35% every 5 years) is attained, and (iii) a decline of 50% every 5 years is attained.
Brazil
Although the current trend in Brazil diverges from the WHO target, we found that the G2D prevalence in 2015 was approximately 71 000 individuals in all three scenarios, owing largely to the G2D cases detected during 1981–2009. We also observed that, for 2015, cases detected after 2010 contributed around 15% in any scenario. Furthermore, when we compared the prevalence of G2D in 2035 with that in 2015, we observed a decrease in prevalence in each of the scenarios as follows: 16% if the current trend (12.7% every 5 years) is sustained; 38% if the WHO target is attained, and 47% if there is a decline of 50% every 5 years.
China
In China G2D prevalence was approximately 52 000 individuals, most of them detected in1980 or before. Cases detected after 2010 contributed around 3% in all three scenarios. When we compared the prevalence of G2D in 2035 with that in 2015, we observed a decrease of 68% if China sustains its current trend (8% every 5 years). When we assumed that in 2035 China would either attain the WHO target or a decrease of 50% every 5 years, we observed a decrease of 75% with respect to the prevalence in 2015, mainly attributable to the death of individuals with G2D detected in 1980 or before (since G2DR was high in 1980 or before and relatively low after 1980). If China sustains its current trend, 6400 “new” leprosy patients (detected in 2010–2035) will be living with G2D by 2035. On the other hand, if China attains a decrease of 35% or 50% every 5 years, respectively, only 3000 or 2000 “new” leprosy patients will be living with G2D by 2035.
India
Under any scenario, prevalence in India will be around 490 000 in 2015 and cases detected after 2010 will contribute around 2.5% of that number. By 2035, prevalence would have decreased by 67% in any scenario mainly owing to the decrease in the number of individuals detected during 1981–2009 (since G2DR before 2009 was relatively high).
Thailand
The prevalence in Thailand in 2015 was the same (approximately 5750) under all three scenarios, and cases detected after 2010 will contribute around 4% of that number in any scenario. Trends in Thailand were comparable to trends in China and India, with the 2015 prevalence decreasing by more than half and reaching 60% by 2035 in all three scenarios.
Discussion
The G2DR decreased in Brazil, China, India and Thailand since 1995, with 12.7%, 7.7%, 53.7% and 35.9% declines every 5 years, respectively. Brazil, China, India and Thailand will have an estimated G2D prevalence of 71 000, 52 000, 490 000 and 5750 by 2015. Relative to 2015, the prevalence of G2D in 2035 will have decreased by more than half in China, India and Thailand, with the scenario making little difference. In Brazil, however, the decrease will depend on the scenario: 16% under the current trend, 38% under the WHO target of a 35% drop every 5 years, and 47% if a 50% drop every 5 years occurs.
The data used for our study may not represent the real G2DR of a country. For example, some have wondered to what extent the relative decline in non-communicable diseases in India has been influenced by operational factors (e.g. the expansion of control activities before 2000 and the relaxation of detection after 2000). Such factors have probably also influenced trends in G2D. During 2000–2005 the incidence of G2D dropped by 77%, much more than in 1994–1999 (51% decrease) and 2006–2008 (20% increase).15,16 Similar questions about the likelihood of attaining the WHO target by 2015 have been raised for other countries as well.17 Conclusions from our analysis are therefore as strong as the quality of the data, but we emphasize that our model seeks to present a systematic way of estimating future trends in leprosy impairment, not to provide precise figures.12 In other words, the exact prevalence of G2D is not as important as the trends observed.
Brazil and perhaps China are far from attaining the WHO target. For China the predicted future trends depend highly on the trend chosen. We believe that the trend analysis based on data from 1995 and onwards is more reliable than the trend analysis based on all data since 1957 because after G2DR decreased for years, the rate of decrease stabilized around 1995. The analysis for India is inconclusive owing to the poor quality of the data. The huge drop between 2000 and 2005 is biologically implausible and was most likely caused by changes to the National Leprosy Control Programme in India after the leprosy elimination target was reached.18 A transition to the current National Leprosy Eradication Programme took place and included the decentralization of services to the state and district levels and the integration of leprosy services into the general health-care system. Within this system it has proved difficult to provide an effective referral mechanism for the diagnosis and care of leprosy patients.19
The trend in Thailand is based on consistent and reliable data and the projected decline can be considered feasible. Hence, Thailand will not need to change its current control programme to reach the WHO target. In all countries the projected prevalence of G2D in 2015 depended only marginally on the scenario applied. For 2035, the chosen scenario exerted an effect only in Brazil and to a lesser degree in China. The scenario chosen affected the decrease in prevalence between 2015 and 2035 only slightly in China and negligibly in India and Thailand. This is because the most recent G2DRs reported for China, India and Thailand were so close to zero that the differences between the first, second and third scenarios became extremely small. In Brazil the G2DR was relatively high, whereas in Thailand and India the decreases were already close to or greater than the WHO target.
The new WHO strategy will have different implications for each of the four countries examined in this study. Thailand’s downward trend in G2DR slightly exceeds the WHO target and will lead to a 60% reduction over the next 25 years in the number of individuals with leprosy-related G2D. It is important that the national programme in Thailand maintain this trend, and any improvement will further reduce the burden of disease. In contrast, Brazil and China show slow decreases in G2DR, but the effect of such decreases will be very different in each country. The data on G2DN, G2DR, G2D%, and G2D prevalence need to be interpreted in the light of other information about the national leprosy programme and about underlying trends in leprosy. In China G2D% is around 22% compared with 6% in Brazil, and in both settings delays in diagnosis need to be addressed. By 2035, the prevalence of G2D in China is projected to decline by 68% despite the low rate of decline in G2DR caused by the ageing of those affected. However, in Brazil the rate of decline in G2DR will have a far greater effect on the long-term burden of disease. Since the current decreasing trend in G2DR would only slightly reduce the prevalence of G2D by 2035, Brazil must attain the 35% target if it is to reduce the burden of disease in the long term. In India the prevalence of disability will decrease by around 67% in the long term if current trends are maintained, but only as long as the national programme sustains the current rate of decline over the next 25 years through early case detection.
The Enhanced Global Strategy for Further Reducing the Disease Burden due to Leprosy 2011–2015 has a wide range of objectives, including using G2DR as a key indicator to monitor progress, in addition to current indicators such as prevalence, new case detection rates and treatment completion rates.5 To facilitate reaching the objectives, some have proposed introducing as a global target the reduction of new cases of leprosy-related G2D per 100 000 general population by at least 35% by the end of 2015 relative to the end of 2010 (baseline). In our study we show that this target has limitations but that it should be viewed in relation to all of the indicators used in the Enhanced Global Strategy to monitor progress, evaluate case detection and assess the quality of services. Other important objectives of the strategy are: (i) to strengthen routine and referral services within the integrated health systems in all endemic countries; (ii) to implement innovative approaches for case-finding to reduce delayed diagnoses and G2D among newly diagnosed leprosy cases; (iii) to improve the quality of clinical services for the diagnosis and management of acute and chronic complications and for the prevention of disabilities or impairments, and to enhance rehabilitation services through a well organized referral system; (iv) to support all initiatives to promote community-based rehabilitation and especially to reduce stigma and discrimination against leprosy patients and their families; and (v) to explore the use of chemoprophylaxis to prevent new leprosy cases among household contacts.5 Indicators for monitoring progress in these areas will help in reaching important underlying targets for reducing disease burden, such as good referral and rehabilitation services that fully cover the population wherever leprosy is endemic. An effective referral system is a vital but currently missing link in the sustainability of leprosy services in integrated health settings, as Sundar Rao has pointed out.19
We conclude that Brazil and China are far from attaining the WHO target and that Thailand is the only one of the countries we examined that does not need to change its current leprosy programme to do so. The analysis for India is inconclusive, although India is not likely to attain the WHO target unless current control efforts are intensified. Sustaining the WHO target for only 5 years will only minimally reduce the number of people living with G2D in the world by 2015, and the same is true for India and Thailand if they sustain the WHO target until 2035. For China attaining the WHO target will only slightly reduce G2D prevalence. However, the prevalence of G2D in Brazil in 2035 will strongly depend on whether the WHO target is attained.
Acknowledgements
We thank Caspar WN Looman (Erasmus MC) for his support. This project was carried out as part of the internship for the Master of Clinical Epidemiology at the Netherlands Institute of Health Sciences, Department of Public Health, Erasmus MC, University Medical Centre Rotterdam, the Netherlands.
Competing interests:
None declared.
References
- 1.Mathers CD, Ezzati M, Lopez AD. Measuring the burden of neglected tropical diseases: the global burden of disease framework. PLoS Negl Trop Dis. 2007;1:e114. doi: 10.1371/journal.pntd.0000114. [DOI] [PMC free article] [PubMed] [Google Scholar]
- 2.Britton WJ, Lockwood DN. Leprosy. Lancet. 2004;363:1209–19. doi: 10.1016/S0140-6736(04)15952-7. [DOI] [PubMed] [Google Scholar]
- 3.Durrheim DN, Speare R. Global leprosy elimination: time to change more than the elimination target date. J Epidemiol Community Health. 2003;57:316–7. doi: 10.1136/jech.57.5.316. [DOI] [PMC free article] [PubMed] [Google Scholar]
- 4.Smith C, Richardus JH. Leprosy strategy is about control, not eradication. Lancet. 2008;371:969–70. doi: 10.1016/S0140-6736(08)60433-X. [DOI] [PubMed] [Google Scholar]
- 5.Anonymous. Enhanced Global Strategy for Further Reducing the Disease Burden due to Leprosy (plan period: 2011-2015) New Delhi: WHO Regional Office for South-East Asia; 2009. [Google Scholar]
- 6.Brandsma JW, Van Brakel WH. WHO disability grading: operational definitions. Lepr Rev. 2003;74:366–73. [PubMed] [Google Scholar]
- 7.Anonymous. Monitoring grade-2 disability rate and application of chemoprophylaxis in leprosy control: report of the informal consultation, London, United Kingdom, 12–13 November 2009. New Delhi: WHO Regional Office for South-East Asia; 2010. [Google Scholar]
- 8.Chen XS, Li WZ, Jiang C, Ye GY. Leprosy in China: epidemiological trends between 1949 and 1998. Bull World Health Organ. 2001;79:306–12. [PMC free article] [PubMed] [Google Scholar]
- 9.Sinan/SVS-MS Brazil 2001-2009. http://dtr2004.saude.gov.br/sinanweb/index.php (accessed December 29, 2010)
- 10.Total midyear population for Brazil, China, India and Thailand: 1950–2050. Washington: U.S. Census Bureau. Available from: http://www.census.gov/ [accessed 1 April 2011].
- 11.De Oliveira MLW. Utilization of the grade 2 physical disability\100,000 inhabitants as a new target indicator of leprosy programs Brasilia: Ministry of Health; 2010. Available from: http://portal.saude.gov.br/portal/arquivos/pdf/targetindicator.pdf [accessed 1 April 2011].
- 12.Meima A, van Veen NH, Richardus JH. Future prevalence of WHO grade 2 impairment in relation to incidence trends in leprosy: an exploration. Trop Med Int Health. 2008;13:241–6. doi: 10.1111/j.1365-3156.2007.01996.x. [DOI] [PubMed] [Google Scholar]
- 13.Bureau of Epidemiology. Thailand [Internet]. [Non-communicable disease surveillance 2002-2008]. Thai. Available from: http://epid.moph.go.th/ [accessed 1 April 2011].
- 14.World Health Organization [Internet]. WHOSIS, life-table: 1990, 2000, 2008, by country. Available from: http://www.who.int/healthinfo/statistics/mortality_life_tables/en/ [accessed 1 April 2011].
- 15.Anonymous Leprosy–global situation. Wkly Epidemiol Rec. 2000;75:226–31. [PubMed] [Google Scholar]
- 16.Anonymous Global leprosy situation, 2007. Wkly Epidemiol Rec. 2007;82:225–32. [PubMed] [Google Scholar]
- 17.Fine PE. Global leprosy statistics: a cause for pride, or frustration? Lepr Rev. 2006;77:295–7. [PubMed] [Google Scholar]
- 18.Richardus JH, Habbema JDF. The impact of leprosy control on the transmission of M. leprae: is elimination being attained? Lepr Rev. 2007;78:330–7. [PubMed] [Google Scholar]
- 19.Rao PS. Referral system: a vital link in the sustainability of leprosy services. Lepr Rev. 2010;81:292–8. [PubMed] [Google Scholar]


