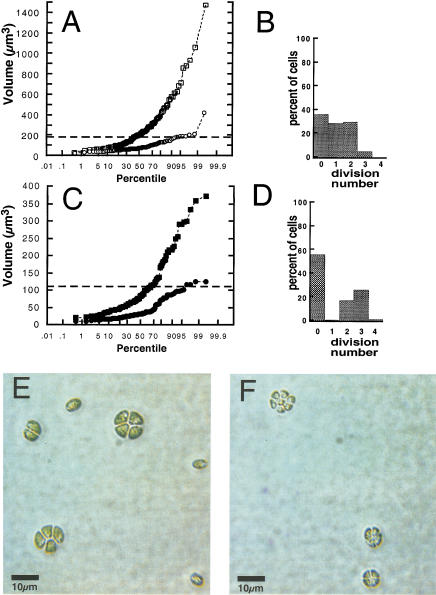
Figure 3.
Cell cycle analysis of asynchronous wild-type and mat3-4 cultures. (A,C) Volume distributions of wild-type (A) and mat3-4 (C) strains grown asynchronously in continuous light and kept in log phase for at least 14 generations (squares), then shifted to the dark for 24 h (circles). The X-axis is a logarithmic scale showing the percentile ranking of cells by size. The horizontal dashed lines indicate volumes of 178 μm3 (A) and 110 μm3 (C), which are the respective commitment size thresholds for wild-type and mat3-4 strains. (B,D) Wild-type (B) and mat3-4 cells (D) from continuous light cultures in A and C were plated in the dark. After 24 h dark incubation, cells were scored for the number of divisions they underwent and the results plotted as percentages of cells in each division number category. (E,F) Photomicrographs of division clusters from wild-type (E) and mat3-4 (F) strains.

