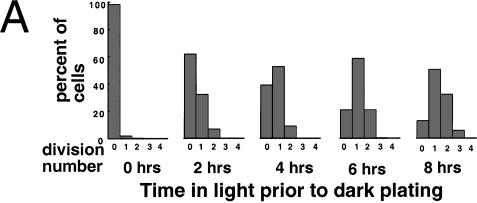
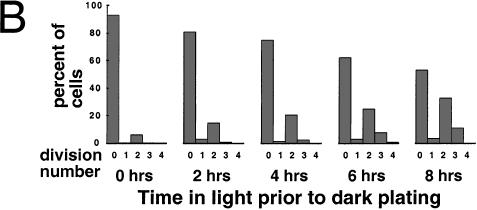
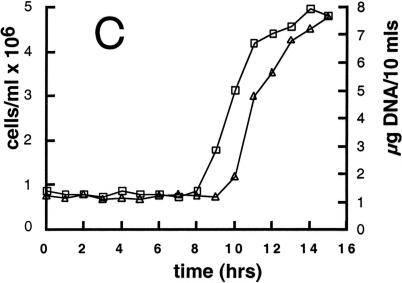
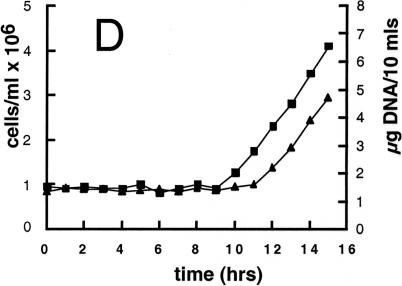
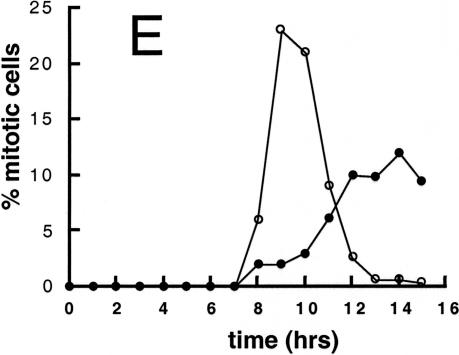
Figure 4.
Cell cycle analysis of synchronized wild-type and mat3-4 cultures. (A and B) Division number histograms of wild-type (A) and mat3-4 (B) strains. Dark-incubated cultures from Fig. 3 were returned to the light, and at the indicated times an aliquot of cells was removed and plated in the dark. The division numbers of the cells are plotted as in Fig. 3. (0 h) Beginning of the light period. (C–E) Cell number (triangles), DNA content (squares), and mitotic state (circles) were analyzed at the indicated times for wild-type (open symbols) and mat3-4 (filled symbols) cultures as they grew continuously in the light.

