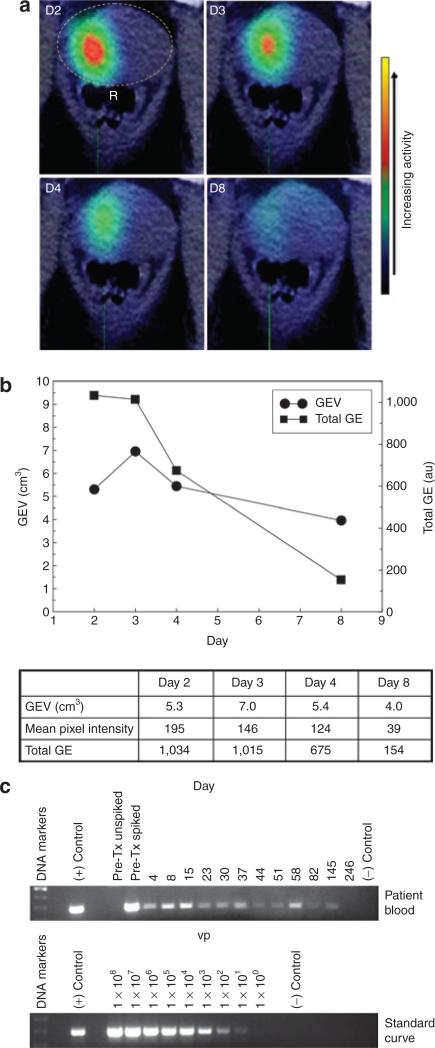
Figure 4. Kinetics and persistence of gene expression (GE) in the prostate in patient 10.
The Ad5-yCD/mutTKSR39rep-hNIS adenovirus was injected on day 1 at 1 × 10¹² virus particles (vp). a, Fused computerized tomography/single photon emission–computed tomography images of a single transverse section at the maximum intensity of GE 1 (D2), 2 (D3), 3 (D4), and 7 (D8) days after adenovirus injection. In the day 2 panel, the prostate is indicated by a dashed yellow oval and the rectum is labeled R. The color bar on the right indicates the relative activity. (b) The volume (circles) and total amount (squares) of GE on each day of imaging are plotted. Actual values are shown in the table along with the mean pixel intensity. (c) PCR of Ad5-yCD/mutTKSR39rep-hNIS viral DNA in blood. Pre-Tx unspiked, pretreatment blood with no added adenovirus. Pre-Tx spiked, pretreatment blood spiked with 1 × 10⁴ vp of Ad5-yCD/mutTKSR39rep-hNIS. The day of each blood draw is indicated above the lanes with day 1 being the day of the adenovirus injection. (+) Control, purified Ad5-yCD/mutTKSR39rep-hNIS viral DNA. (–) Control, no DNA. The PCR signal reflects the amount of adenoviral DNA present in 20 μl of blood. To calculate the total adenoviral load, use the standard curve to estimate the viral particles and multiply by 250,000 (50 to account for volume of blood used in the PCR assay and 5,000 to account for the average human blood volume). At its peak (day 15), the viral load was ~2.5 × 10⁸ vp, or ~0.025% of the injected adenovirus dose. The number above each lane in the standard curve indicates the amount of adenoviral DNA in vp. The sensitivity of the PCR assay is at least 10 vp. hNIS, human sodium iodide symporter.

