Figure 2.
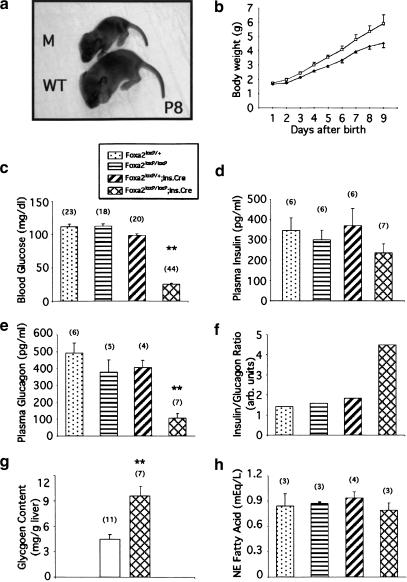
Foxa2loxP/loxP; Ins.Cre mice are growth-retarded and die shortly after birth because of severe hyperinsulinemic hypoglycemia. (a) Eight-day-old (P8) Foxa2loxP/loxP; Ins.Cre mutant mouse (M; top) and a control littermate (WT; bottom) from a typical litter between Foxa2loxP/+; Ins.Cre and Foxa2loxP/loxP mice on a mixed outbred-CD1 background. (b) Growth curve for a litter obtained from mating Foxa2loxP/+; Ins.Cre and Foxa2loxP/loxP mice. Foxa2loxP/loxP; Ins.Cre mutant mice (filled diamond) are growth retarded relative to control littermates (open square). Between P9 and P12, Foxa2loxP/loxP; Ins.Cre mutant mice lose weight rapidly, and most die with severe hypoglycemia. Values are means ± SEM of n = 5 mice. (c–e,h) Offspring from matings between Foxa2loxP/+; Ins.Cre and Foxa2loxP/loxP mice were killed on P8 and blood glucose (c), plasma insulin (d), plasma glucagon (e), and plasma nonesterified (NE) fatty acid (h) concentrations were determined as described in Materials and Methods. Each bar represents the mean ± SEM, with the number indicated in parenthesis. **, P < 0.005; Foxa2loxP/loxP; Ins.Cre (cross-hatched bars) vs. Foxa2loxP/+ (stippled bars) or Foxa2loxP/loxP (horizontal-striped bars) or Foxa2loxP/+; Ins.Cre (hatched bars). (f) The insulin to glucagon ratio was determined by dividing mean plasma insulin concentrations (d) by mean plasma glucagon concentrations (e). (g) Liver glycogen content was determined in P8 Foxa2loxP/loxP; Ins.Cre mutant mice (cross-hatched bars) and control littermates (unfilled bars). Each bar represents the mean ± SEM, with the number indicated in parenthesis. **, P < 0.005; Foxa2loxP/loxP; Ins.Cre vs. all control littermates.

