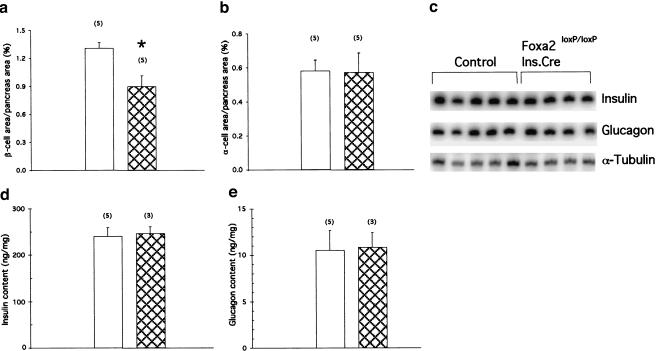
Figure 4.
Quantitative analysis of islet cell area and biosynthesis of insulin and glucagon in Foxa2loxP/loxP; Ins.Cre mice. (a,b) Pancreatic sections from eight-day-old control (P8; unfilled bars) and Foxa2loxP/loxP; Ins.Cre (Mutant, cross-hatched bars) mice were immunostained for both insulin and glucagon to determine β-cell area (a) and α-cell area (b), respectively, which were normalized to total pancreatic area (pancreas area). Bars represent means ± SEM, with number indicated in parenthesis. *, P < 0.05; Foxa2loxP/loxP; Ins.Cre vs. control mice. (c) Reverse-transcription analysis of total RNA isolated from whole pancreata of P8 control and Foxa2loxP/loxP; Ins.Cre mice. No significant differences between control and mutant mice in insulin 1 (Insulin) or glucagon steady-state mRNA levels were detected when quantified using phosphorImager analysis (data not shown). α-Tubulin served as a loading control. (d,e) Pancreatic insulin (d) and glucagon content (e) were measured in acid-ethanol extracts from P8 control (unfilled bars) and Foxa2loxP/loxP; Ins.Cre (Mutant, cross-hatched bars) mice by RIA. Bars represent values ±SEM, with number indicated in parenthesis.

