
Table 1.
Statistical results with standard deviations of collagen types I and IV and TIMP-2 in groups S, 0P, 3P, and 24P
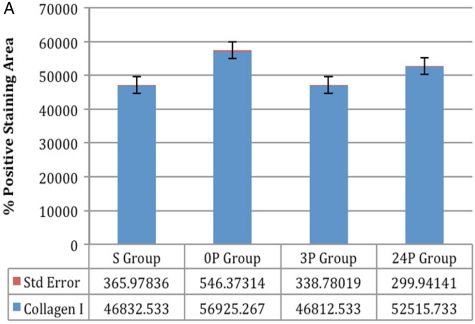 (A) Collagen I: comparison between groups S and 3P was not significant and comparison between all other groups was significant (P < 0.005, P < 0.0001) (A) Collagen I: comparison between groups S and 3P was not significant and comparison between all other groups was significant (P < 0.005, P < 0.0001) |
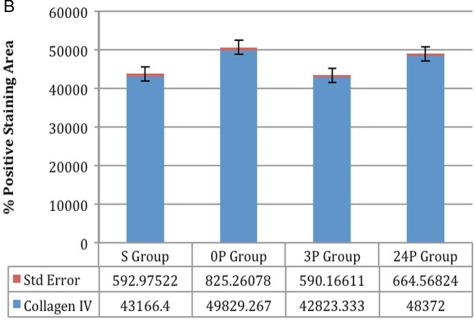 (B) Collagen IV: comparison between groups 0P and 24P, and comparison between groups S and 3P was not significant; comparison between all other groups was significant (P < 0.005, P < 0.0001) (B) Collagen IV: comparison between groups 0P and 24P, and comparison between groups S and 3P was not significant; comparison between all other groups was significant (P < 0.005, P < 0.0001) |
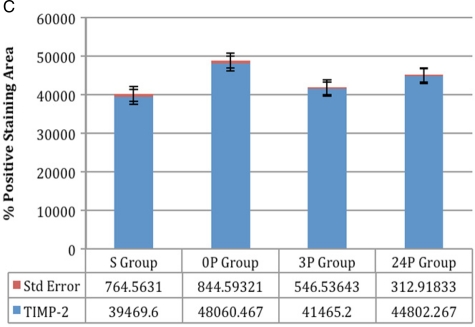 (C) TIMP-2: Comparisons between groups 0P and 24P and between groups S and 3P were not significant; comparison between all other groups was significant (P < 0.005, P < 0.0001) (C) TIMP-2: Comparisons between groups 0P and 24P and between groups S and 3P were not significant; comparison between all other groups was significant (P < 0.005, P < 0.0001) |