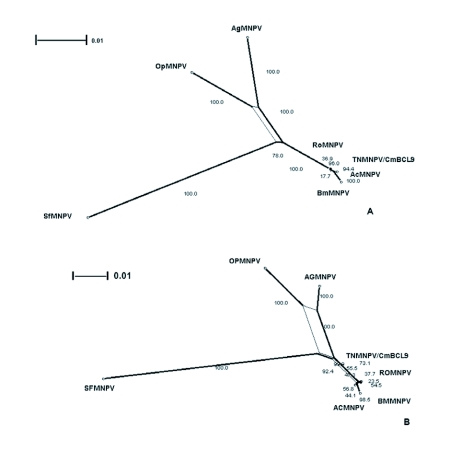
Figure 8.
The split-graph of aligned egt DNA sequences from seven baculovirus 33 including TNMNPV/CmBCL9. This network is based on a logDet character transformation matrix and split-decomposition distance transformation. The fit index 35 indicates that 95% of the original distance is represented by the split-graph. (B) The split-graph of the aligned egt protein translated DNA sequences from seven 37 baculovirus including TNMNPV/CmBCL9. The split index is 98.1%. The splits were calculated employing the ProteinMLdist character transformation and split- 39 decomposition distance transformation.

