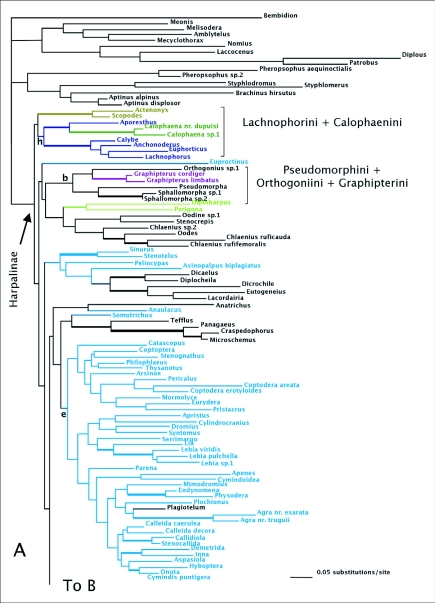
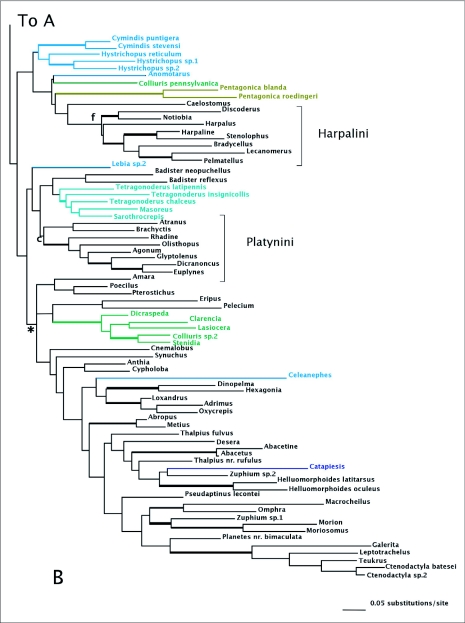
Figure 4.
One of three trees of highest likelihood from the wg dataset. Thick branches show clades supported by greater than 95% posterior probability from Bayesian inference. Trees differ un the relationships of immediate descendants of the node marked by *. Colored branches are members of the lebiomorph assemblage color coded by tribe, (b) represents Orthogoniini + Graphipterini + Pseudomorphini clade, (c) Platynini, (e) Lebiini, (f) Harpalini, (h) Lachnophorini + Calophaena.


