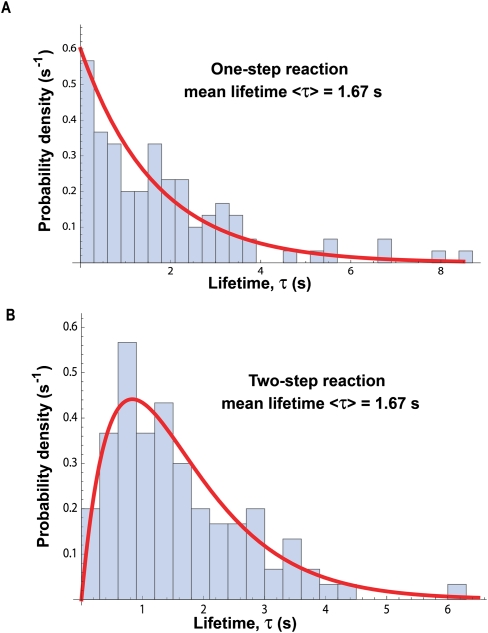
Figure 2.
The distribution of lifetimes measured in single-molecule experiments. (A) A distribution of 100 lifetimes expected for a single reaction with rate constant k = 0.60 sec−1. The distribution is exponential with a mean lifetime <τ> = 1/k = 1.67 sec. Note that a measured lifetime can vary from 0.1 sec to 8 sec, in principle from zero to infinity. (B) A distribution of 100 lifetimes expected for two successive reactions, which produce the new species; each rate constant k = 1.20 sec−1. The distribution is no longer exponential, but its mean lifetime <τ> = 2/k = 1.67 sec.

