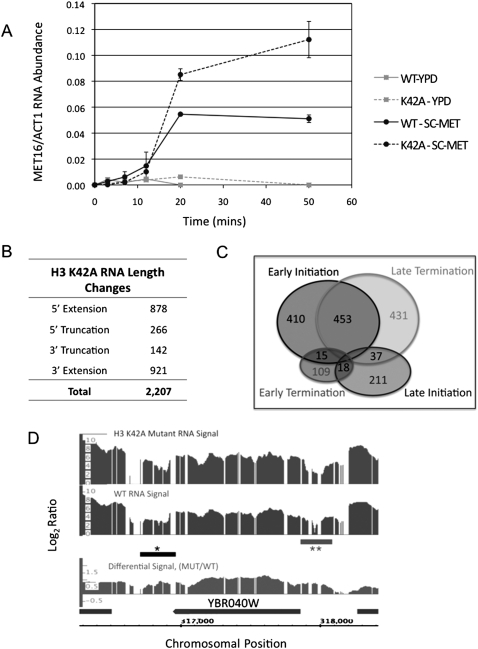
Figure 2.
Histone H3-K42A alters the S. cerevisiae transcriptome. (A) Kinetics of appearance of MET16 mRNA in cells expressing wild-type (WT) or K42A histone H3, as described in the Materials and Methods. Error bars represent the standard deviation between two biological replicates of each sample, each assayed in triplicate. (B) Table summarizing RNA length changes detected in H3-K42A cells using yeast genomic tiling array as described in the Materials and Methods. Four classes of mRNA length changes were analyzed, and the number of transcripts in K42A cells that fall into each class is indicated. (C) Venn diagram representing the number of genes within each class of RNA length change. The overlap regions indicate the counts of loci showing aberrant RNA length changes that can be classified by two distinct transcriptional events. (D) Integrated Genome Browser screen shot of log2 wild-type (WT) and H3-K42A RNA levels, as well as the differential RNA levels (log2 K42A/WT) for a segment of chromosome 2 spanning YBR040W. The horizontal bars marked with asterisks represent aberrant length changes, indicating both 5′ extension (**) and 3′ extension (*) events at this locus.

