
Fig. 2.
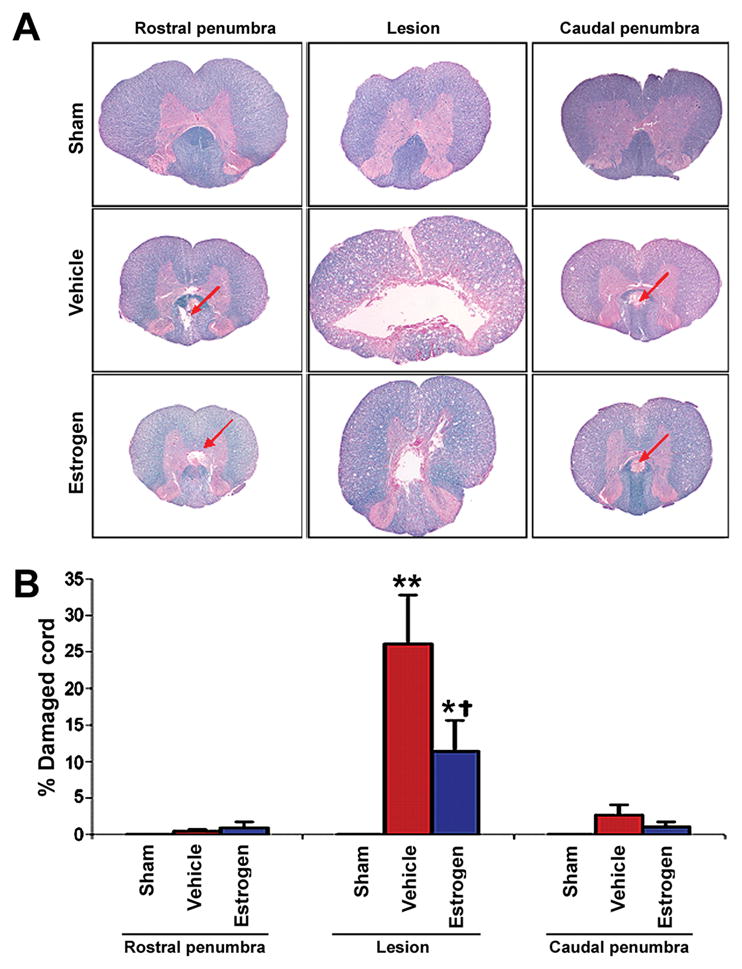
Assessment of myelin integrity using LFB staining. Thin (10 μm) sections were cut from paraffin-embedded spinal cord tissues. A: Representative samples are shown (at 40x magnification). Focal areas of pathology in the penumbra are indicated with red arrows. B: From each spinal cord segment, sections were taken at 500 μm intervals and were assessed for damage. Significant difference from sham values was indicated by *P <0.05 or **P < 0.0001. Significant difference between vehicle and estrogen was indicated by †P < 0.05 (n ≥ 3).