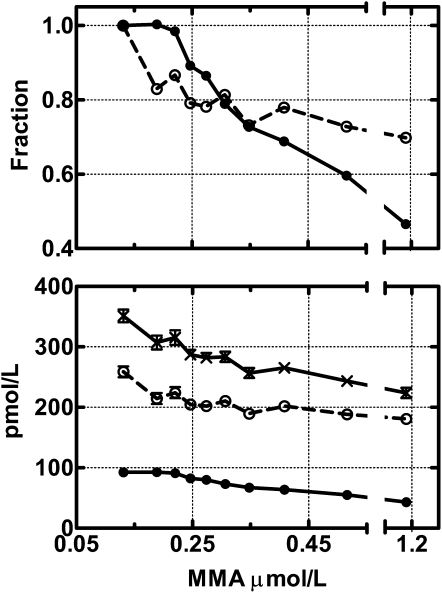
FIGURE 3.
Holotranscobalamin (holoTC) and cobalamin (vitamin B-12) in relation to methylmalonic acid (MMA). The figure shows combined data from Hvas and Nexo (32) and Clarke et al (56). The figure includes 1842 data sets divided into tertiles in accordance with elevating MMA values. The x axis denotes the mean MMA value in each group. The upper panel shows the fractional change in holoTC (•) and haptocorrin-bound vitamin B-12 (total vitamin B-12 minus holoTC values; ○). To calculate the fractional change, we divided the mean for each group by the mean for the group with the lowest MMA values. The lower panel shows the absolute values for holoTC (•), haptocorrin-bound vitamin B-12 (○), and total vitamin B-12 (×). The figure depicts the mean (±SEM) for each group.

