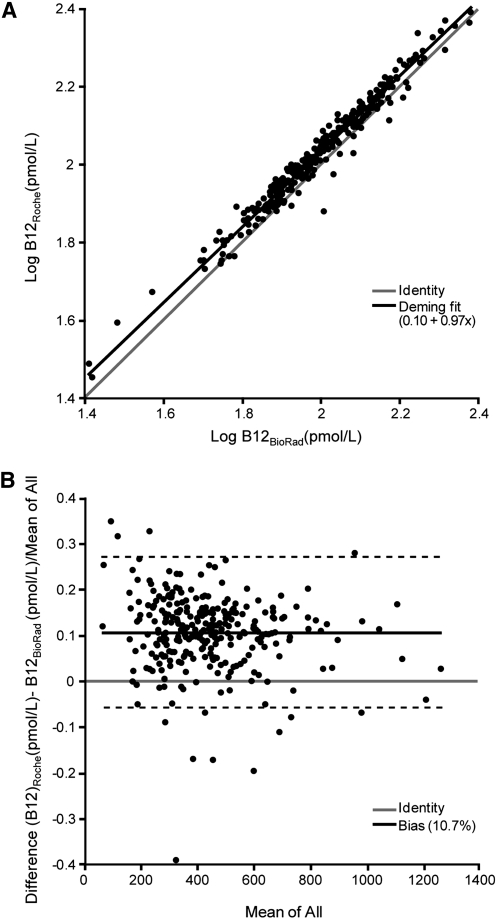
FIGURE 1.
Crossover study (n = 280) comparing serum vitamin B-12 (B12) results using 2 different measurement procedures. A: Scatter plot with Deming regression fit of log-transformed vitamin B-12 concentrations as measured by the Roche E-170 procedure (Roche, Basel, Switzerland). compared with the Bio-Rad Quantaphase II radioimmunoassay (Bio-Rad Laboratories, Hercules, CA). The Deming equation was: log B12Roche = 0.97 × log B12Bio-Rad + 0.10 pmol/L. The SE was 0.012 for the slope and 0.025 for the intercept. B: Bland-Altman difference plot of vitamin B-12 concentrations between the Roche E-170 procedure and the Bio-Rad Quantaphase II radioimmunoassay. Each data point represents the relative difference between the 2 assays as a function of the mean between the 2 assays. The mean relative bias for the Roche procedure compared with the Bio-Rad procedure was 10.7%, and the 95% limits of agreement were from −5.6% to 27%.

