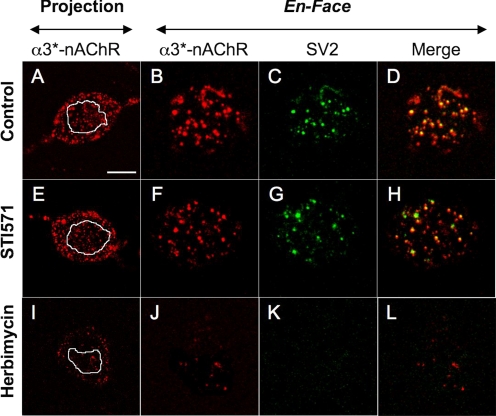
Fig. 5.
Abl kinase inhibition fails to alter α3*-nAChR surface distribution or synaptic localization. Confocal images of CG neuron somas from 4-day cultures show α3*-nAChRs (labeled with mAb35, red), SV2-containing presynaptic terminals (labeled with mAbh-10, green), and synaptic sites, where they overlap (yellow). A, E, and I, z-stack optical projections from soma midline to top surface reveal an extensive distribution of α3*-nAChRs. The white outlines depict the region of interest (ROI) boundaries of subsequent single en-face optical sections. B, F, and J, en-face optical sections depict the distribution of α3*-nAChR clusters at the soma surface. C, G, and K, corresponding single en-face optical sections depicting the SV2-containing presynaptic terminals. D, H, and L, merged images showing α3*-nAChR clusters colocalized with presynaptic terminals (yellow). Note that compared with untreated controls (A to D), the pattern of α3*-nAChR and SV2 labeling is unaltered in neurons treated with STI571 (10 μM, 24 h; E to H), but drastically different in neurons treated with herbimycin A (0.5 μg/ml, 24 h; I–L). Calibration bar, 10 μm in projection panels; 5 μm in en-face panels.

