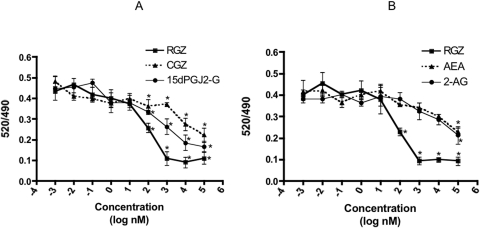
Fig. 3.
Lanthascreen TR-FRET PPARγ competitive binding assay. A, effect of 15d-PGJ2-G, CGZ, and RGZ. B, effect of 2-AG and AEA. The reaction mixture contained 0.5 nM PPARγ-LBD (GST), 5 nM Terbium-tagged anti-GST antibody, 5 nM Fluormone Pan-PPAR Green, 5 mM dithiothreitol, and varying concentrations of RGZ, CGZ, 15d-PGJ2-G, 2-AG, and AEA (1 pM–100 μM). After 3-h incubation in the dark, TR-FRET measurements were made in the SPECTRAmax GEMINI XS spectrofluorometer. The results are the mean ± S.E. of triplicate cultures. Statistical significance is indicated by *, p < 0.05 compared with the TR-FRET ratio of respective vehicle control (VEH of RGZ, 5% EtOH: 0.43063; VEH of CGZ and 15d-PGJ2-G, 1% EtOH: 0.44179; VEH of 2-AG and AEA, 1% EtOH: 0.43342). The results are representative of three separate experiments.

