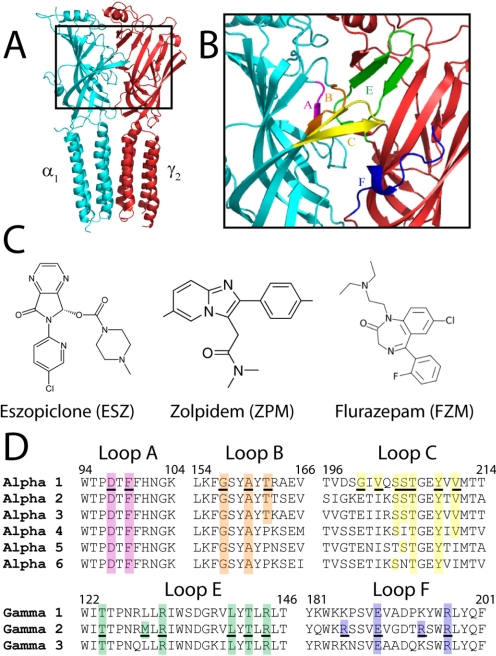
Fig. 1.
The BZD binding site at the α1/γ2 interface of the GABAAR and structures of BZD site ligands. A, homology model of the α1/γ2 interface perpendicular to the plane of the membrane. The α1 subunit is in blue and the γ2 subunit is in red. B, the region of the α1/γ2 interface that contains the BZD binding site is expanded, and BZD binding-site loop regions A to F are each highlighted in a different color. C, structures of BZD ligands ESZ, ZPM, and FZM. D, sequence alignments of the extracellular domain of α1–6 and γ1–3 rat GABAAR subunit isoforms with BZD binding site loops are shown. Loop regions are colored as in B. Residues mutated in this study are underlined and residues highlighted in color are identical. Numbering refers to α1 and γ2 residues.

