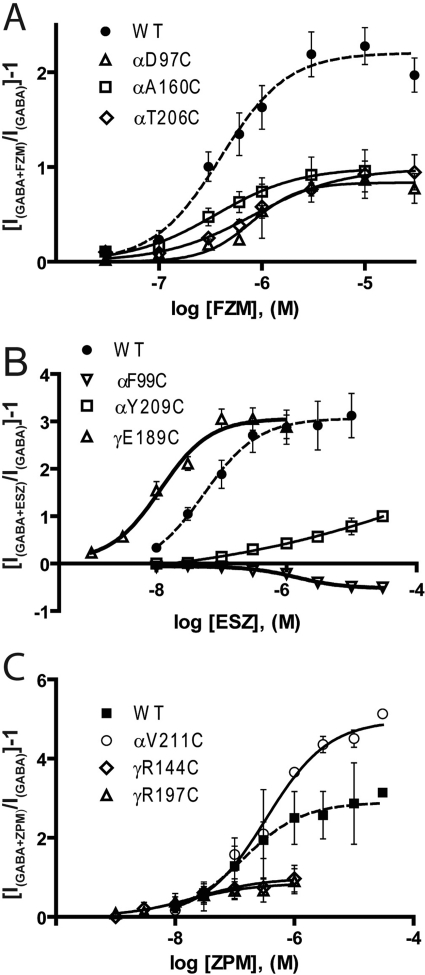
Fig. 3.
BZD concentration-response curves from WT and mutant GABAARs for FZM (A), ESZ (B), and ZPM (C). BZD potentiation was calculated as [(IGABA+BZD/IGABA) − 1]. Data represent mean ±S.E.M. Data were fit by nonlinear regression, as described under Materials and Methods. Dashed lines are curve fits from WT receptors. BZD EC50 values and BZD maximal potentiation values are reported in Table 2.

