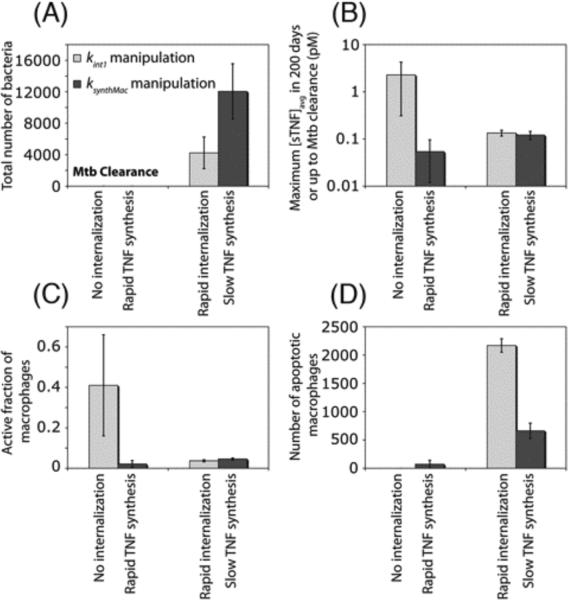
Figure 5.
Manipulations in the rate constants for TNFR1 internalization (kint1) and mTNF synthesis (ksynthMac) lead to different effects on model outputs. Simulation results show the effect of manipulations in kint1 and ksynthMac on (A) bacterial levels 200 days after Mtb infection, (B) maximum sTNF concentration, (C) maximum fraction of macrophages that become activated following Mtb infection and (D) TNF-induced macrophage apoptosis within a 200-day period after Mtb infection (No internalization: kint1 = 0, rapid TNF synthesis: ksynthMac = 1 #/cell.s, rapid internalization: kint1 = 1.5×10⁻³ s−1, slow TNF synthesis: ksynthMac = 0.1 #/cell.s).

