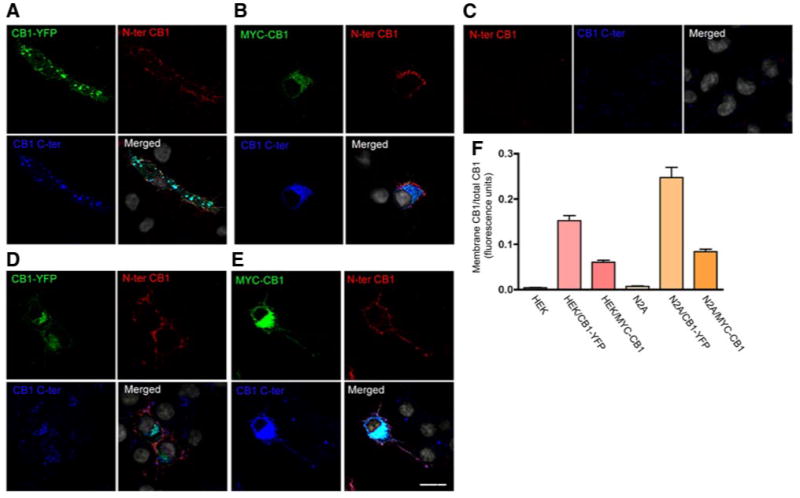
Figure 1.

Cell surface localization of endogenous and transfected CB1 receptors. A–E) HEK293 cells transfected with CB1-YFP (A), myc-CB1 (B), and Neuro2A cells not transfected (C) or transfected with CB1-YFP (D) or myc-CB1 (E), were incubated with an anti-N-terminal extracellular domain of CB1 antibody (red). The cells were then fixed and permeabilized for staining of total CB1 using an anti-C-terminus CB1 antibody (blue) and an anti-myc monoclonal antibody (green). YFP fluorescence is shown in green. Nuclei were stained with DAPI (gray). Cells were processed for confocal microscopy as described in Materials and Methods. Micrographs are representative of at least 3 independent experiments. Scale bar = 20 μm. F) Quantification of plasma membrane vs. total CB1 by ELISA. Cells were incubated on ice with primary anti-N terminus CB1 antibody for 90 min then with IRDye 800-labeled anti-goat secondary antibody to obtain the levels of cell surface receptors. After fixation and permeabilization, the cells were incubated with a primary anti-C-terminus CB1 and an IRDye 680-labeled anti-rabbit antibody to obtain the levels total CB1. The plates were imaged by scanning simultaneously at 700 and 800 nm with an Odyssey imaging system as described in Materials and Methods. Specific fluorescence was obtained by subtracting the fluorescence obtained by incubation with secondary antibodies alone. Data represent mean ± se of the ratio of membrane to total CB1 receptors (n=3).
