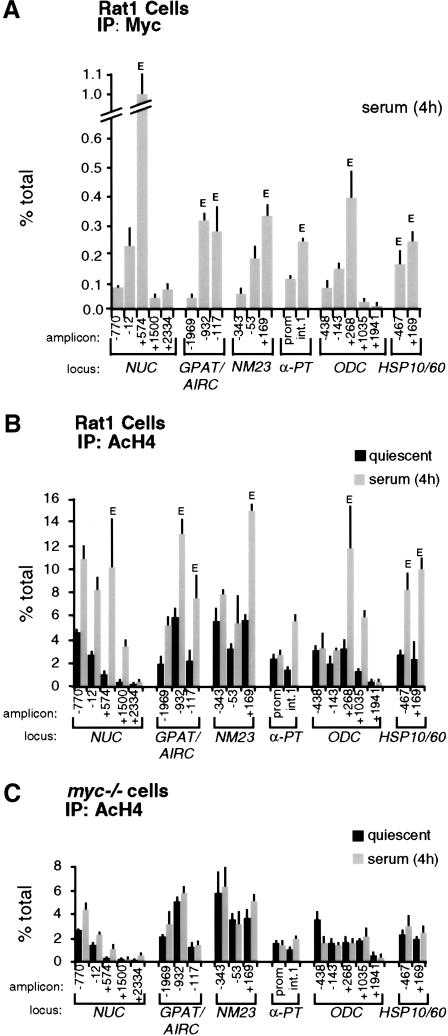
Figure 5.
Localization of Myc and acetylated histones on Myc-target genes by ChIP. (A) Mapping of Myc-binding along its target genes, 4 h after mitogenic stimulation in Rat1 cells. (B) Distribution of acetylated histone H4 along Myc-target genes in quiescent Rat1 cells (black bars) and 4 h after serum stimulation (shaded bars). (C) Same experiment, in myc−/− cells. The identity of each amplicon is indicated below the graphs (see maps in Fig. 1). (E) E-box sites.

