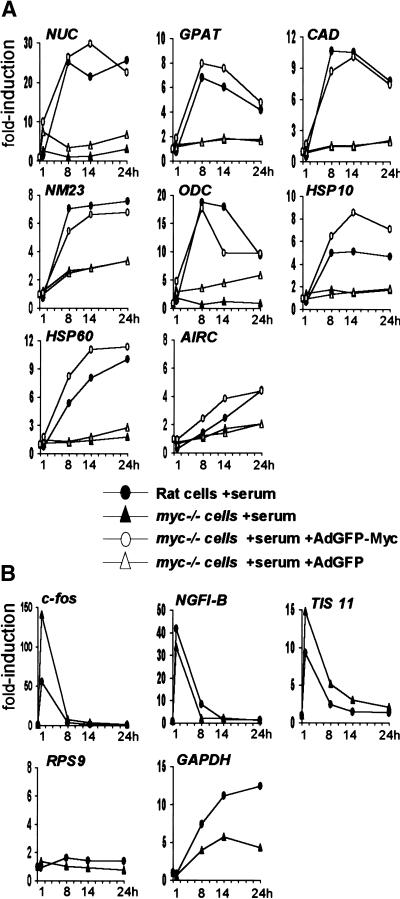
Figure 8.
Induction of Myc-target genes by mitogens is Myc-dependent. Relative mRNA levels for (A) Myc-target genes and (B) control genes, quantified by reverse transcription and real-time PCR. Rat1 cells (filled circles) and myc−/− cells (filled triangles) were analyzed at the indicated time points following mitogenic stimulation. To restore Myc expression in myc−/− cells, these cells were infected at the time of serum stimulation with the recombinant adenovirus AdGFP-Myc (open circles) or with the control virus AdGFP (open triangles). Expression of each gene is represented as the fold-induction relative to untreated quiescent cells (time 0).

