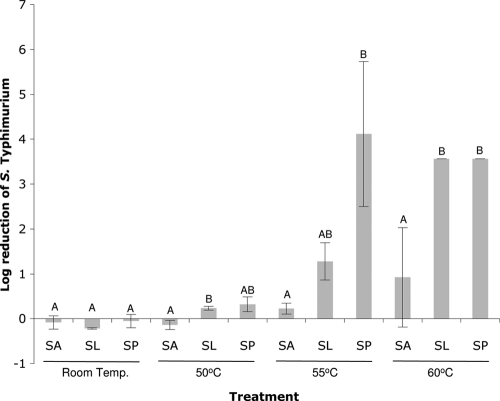
Fig. 1.
Reduction of S. Typhimurium viability following exposure to solutions of 2.5% sodium acetate (SA), sodium lactate (SL), and sodium propionate (SP) at pH 4 relative to the control treatment (dH2O, pH 4) at the four temperatures indicated. Error bars indicate standard deviations. Each of the experimental factors temperature and organic acid contributed significantly to the reduction of S. Typhimurium (P ≤ 0.05). Letters above the bars represent statistically significant differences within each temperature.

