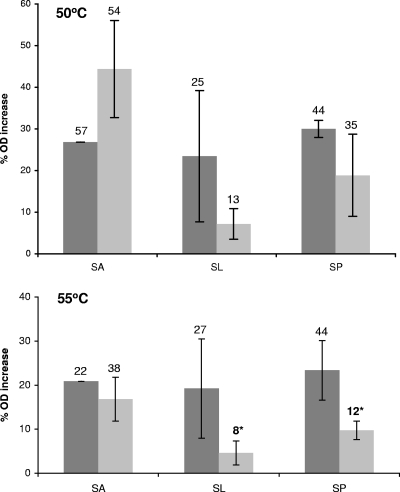
Fig. 2.
Osmotic response of stationary-phase S. Typhimurium to PBS and PBS + 0.75 M NaCl as measured by the percent change in OD680. S. Typhimurium was exposed for 1 min to 50°C (top) or 55°C (bottom) solutions of 2.5% sodium lactate (SL), sodium propionate (SP), or sodium acetate (SA) at pH 7 (dark gray) or pH 4 (light gray). Error bars represent standard deviations, and numbers above each bar show the highest % OD increase recorded. The asterisks indicate pH 4 treatments that were significantly reduced compared to their pH 7 counterparts.

