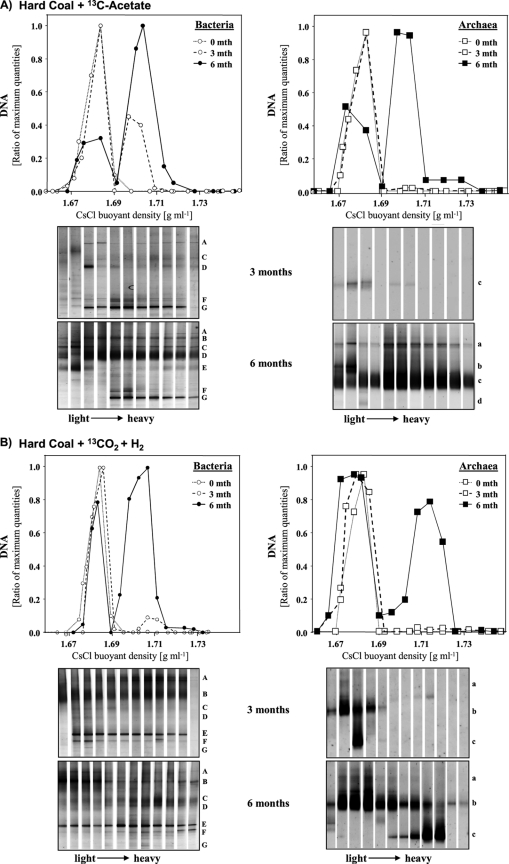
Fig. 2.
Quantitative PCR distribution and DGGE community profiles of density-resolved bacterial and archaeal DNA in SIP centrifugation gradients after 3 and 6 months of incubation of hard coal with [13C]acetate (A) or H2-13CO2 (B). Each letter on the right of a DGGE profile indicates the same band throughout the gradient. Band letters correspond to those in Table 1. The same band letter indicates the same organism.

