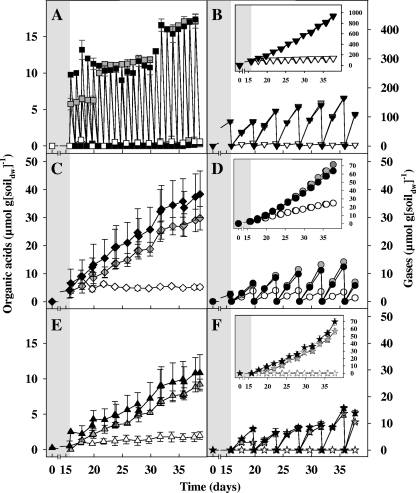
Fig. 2.
Effect of formate on the production of organic acids and gases in anoxic fen soil microcosms at 15°C. Data are for formate (A), CO2 (B), acetate (C), methane (D), propionate (E), and H2 (F). In panel B, CO2 in formate treatments represents the combined CO2 from the bicarbonate pulses and CO2 derived from the apparent conversion of formate to H2 and CO2. Symbols: empty symbols, unsupplemented controls; gray symbols, [12C]formate treatments; black symbols, [13C]formate treatments. Insets show cumulative gas concentrations. Values are the means of triplicate microcosms, and the error bars indicate standard deviations.

