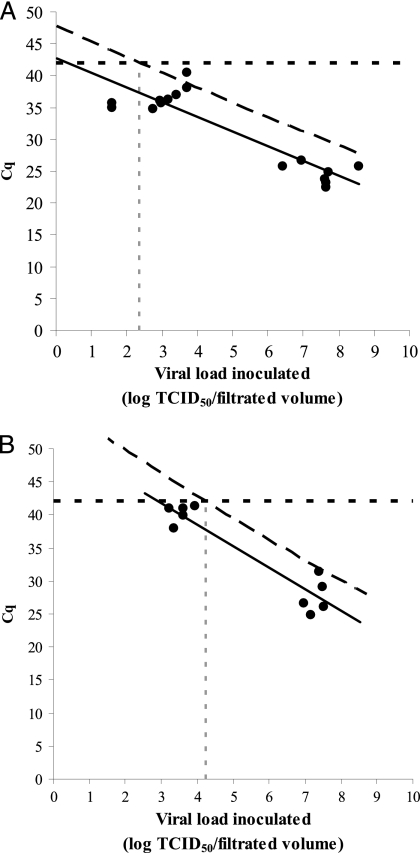
Fig. 2.
Assessment of theoretical detection thresholds of the concentration method by M (A) and H5 (B) gene-specific RT-PCR detections from seeded lake water. The linear regression model (solid line) was built with experimental Cq values obtained by RT-PCR and plotted against inoculated viral loads in water (circles). For a given viral load, the Cq value has a 0.95 probability to fall below the diagonal dashed line. A positive detection occurs for Cq values lower than or equal to 42 (horizontal dotted line). The detection threshold, corresponding to the viral load for which a positive detection is obtained with a probability of 0.95, is thus found at the intersection of these two lines.

