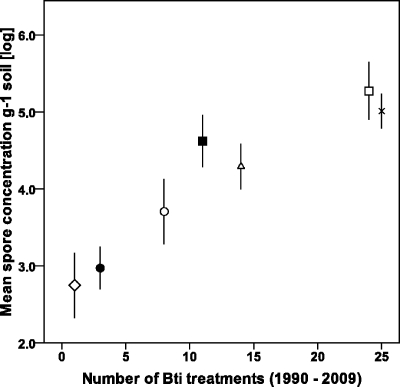
Fig. 3.
Mean concentrations of B. thuringiensis subsp. israelensis spores plotted against the number of B. thuringiensis subsp. israelensis applications from 1990 to 2009. Spore concentrations and B. thuringiensis subsp. israelensis treatments are grouped into intervals of elevation (m a.s.l.), shown by the following symbols: ■, 193.50 to 193.75; □, 193.75 to 194.00; ×, 194.00 to 194.25; ▵, 194.25 to 194.50; ○, 194.50 to 194.75; ●, 194.75 to 195.00; ♢, 195.00 to 195.50. Bars show 95% CIs.

