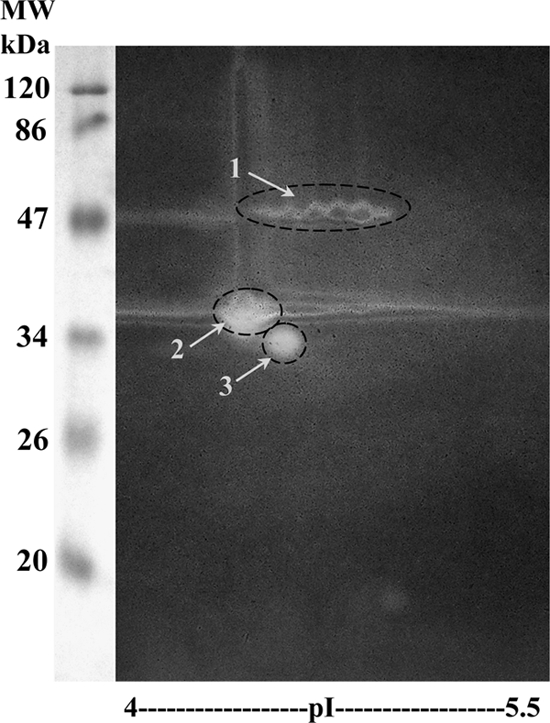
Fig. 3.

Mannanase zymogram (pI 4 to 5.5) produced after 2D gel electrophoresis of protein (approximately 300 μg) from the supernatant of D. stemonitis C8. Spots on the zymogram reveal proteins with mannanase activity. No mannanase activity was detected above pI 5.5. Protein in spots 1 and 2 could be assigned to endo-1,4-β-mannanases in the NCBInr database by Q-TOF LC-MS/MS analysis (Table 1). Spot 3 could not be identified. MW, molecular mass in kilodaltons.
