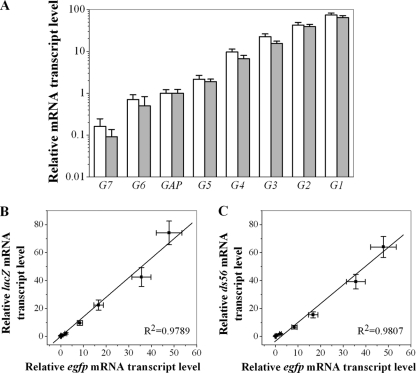
Fig. 5.
Promoter performance was measured directly at mRNA transcript levels of the β-galactosidase gene (lacZ) and the methionine adenosyltransferase gene (ds56). (A) Relative mRNA transcript levels of lacZ (white) and ds56 (gray) under the control of 8 different promoters as indicated. Total RNA was extracted from cells harvested from the logarithmic phase during growth in shake flasks (20 ml YPD medium in 250-ml shake flasks) and measured by quantitative real-time PCR. Relative mRNA transcript levels of the reporters were normalized to the value obtained with the wild-type PGAP. (B) Relative lacZ transcript under the control of 8 different promoters as a function of the egfp transcript driven by the same promoter. (C) Relative ds56 transcript under the control of 8 different promoters as a function of the egfp transcript driven by the same promoter. Data represent means ± standard deviations of three independent cultivations.

