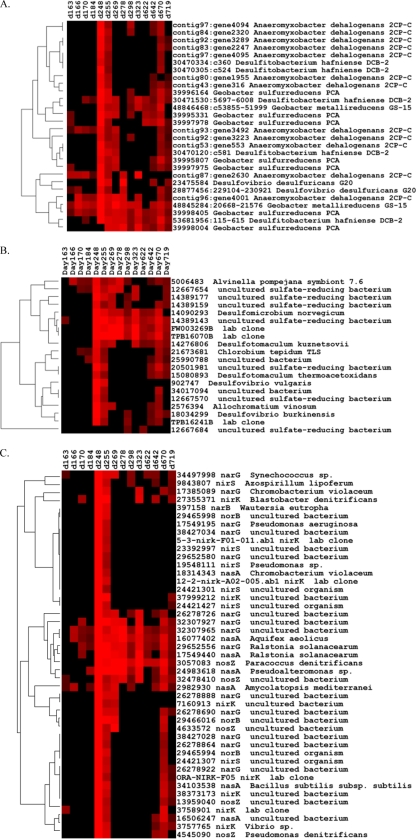
Fig. 4.
Hierarchical cluster analysis of functional genes in FW102-2. Cluster analysis was done for cytochrome c (A), dsr (B), and nitrate/nitrite reduction (C) genes. Results were generated in CLUSTER and visualized using TREEVIEW. Red indicates signal intensities above the background, while black indicates signal intensities below the background. Brighter red indicates higher signal intensities.

