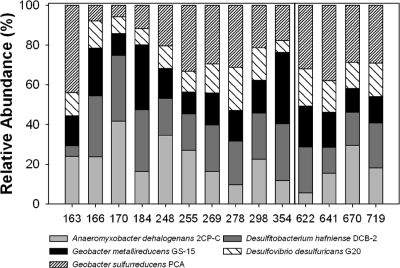
Fig. 5.
Relative abundances of U(VI)-reducing microorganisms in FW102-2. Relative abundances of known U(VI)-reducing microorganisms detected in high abundance in all MLS wells and time points were calculated based on the total signal intensities of cytochrome c genes. Days to the left of the black line are in the active U(VI) reduction phase, while those to the right are in the maintenance phase.

