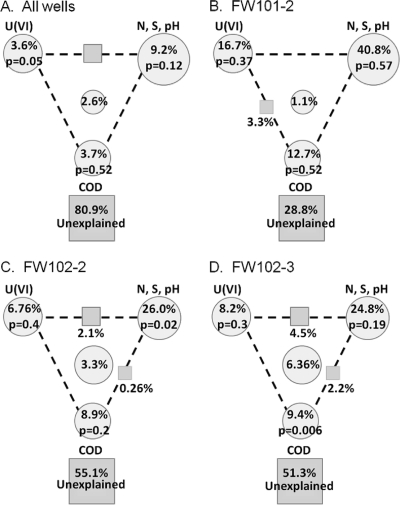
Fig. 7.
Variance partitioning of environmental variables analyzed by CCA. The diagram represents the relative effect of each variable upon the functional community in all wells (A), FW101-2 (B), FW102-2 (C), and FW102-3 (D). The circles represent the effects of individual variables by partitioning out the effects of the other variables. The squares between the circles represent the combined effect of the circles on either side of the square. The square at the bottom of each panel represents the effect that could not be explained by any of the variables tested. Variables used in CCA were used for the VPA. P values shown were generated during partial CCA.

