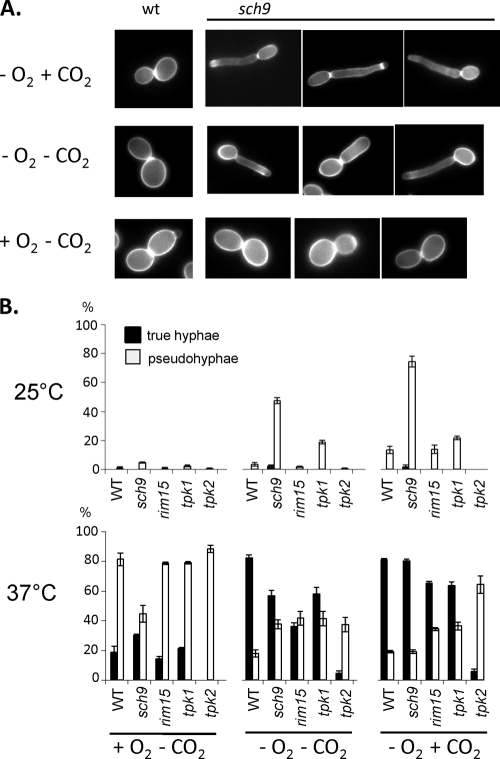
Fig. 3.
Dependence of cellular morphologies on hypoxia and CO2. (A) Cells of sch9 mutant CCS3 and control strain CAF2-1 (wild type [wt]) were grown in liquid YPS for 4 h at 25°C. Cells were grown for 4 h in low oxygen (0.2% O2) containing or not containing 6% CO2. Chitin was stained with calcofluor white (2 μg/ml), and cells were inspected by fluorescence microscopy. (B) Distribution of cell forms in various strains. Cells were grown as for panel A, and at least 100 cells were classified according to their cell form. Percentages of pseudohyphal and true hyphal forms are indicated by the white and black bars, respectively, while the remaining percentage is due to yeast-form cells. For strain designations, see Fig. 1.

