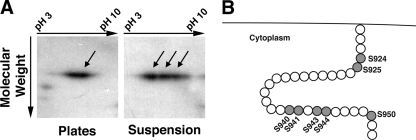
Fig. 3.
2D and bioinformatic analysis of SadA. (A) AX3 wild-type cells were grown under adherent conditions (plates) or under nonadherent conditions (suspension). Cell lysates were subjected to 2D gel analysis followed by Western blotting with a SadA antibody. Under adherent conditions, only one or two SadA reactive spots were seen. However, when grown in suspension, SadA reactivity was observed in a trail, consisting of three to four distinct spots. This trail may represent posttranslational modifications in the tail (i.e., phosphorylation) resulting in charge- induced isoforms. (B) Cartoon depiction of the cytoplasmic SadA carboxy-terminal tail. Shaded residues highlight the seven serine residues, which are putative sites of phosphorylation in this region. There are no threonines and only one tyrosine residue at position 933 in the tail region.

