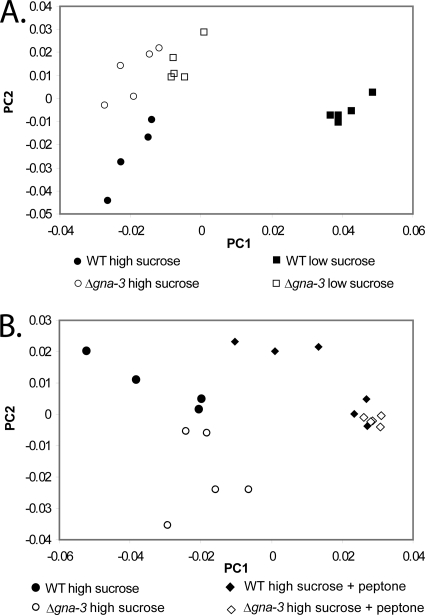
Fig. 3.
Principal component analysis (PCA) score plot. (A) Analysis of results for low- and high sucrose-cultures. PCA analysis of relative integrals from 1H NMR spectra measured for replicate samples of both strains grown under high-sucrose and low-sucrose conditions. In this plot of PC1 versus PC2, the x axis is the value of the first principal component, explaining 55.3% of the variance, while the y axis indicates the second principal component, explaining 24.9% of the variance. (B) Analysis of results for high-sucrose cultures with or without peptone. PCA analysis of 1H NMR data was performed for the strains described for panel A except that high-sucrose cultures with or without peptone were compared. x and y axes are as described for panel A; the first principal component explains 55.4% of the variance, while the second principal component accounts for 18.3% of the variance.

