Fig. 2.
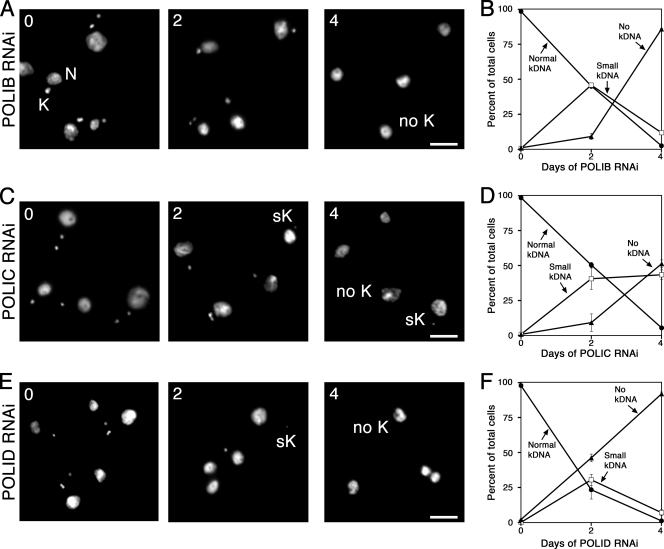
Kinetics of kDNA loss during DNA polymerase silencing. (A, C, E) Representative images of parasites induced for indicated day of RNAi for POLIB (A), POLIC (C), or POLID (E). (B, D, F) Kinetics of kDNA loss were determined by classifying cells as possessing normal-sized kDNA (closed circles), small kDNA (open squares), or no kDNA (closed triangles). The means and standard errors from two inductions are presented for parasites depleted of POLIB (B), POLIC (D), and POLID (F). Abbreviations: N, nucleus; K, normal-sized kDNA; sK, small kDNA; no K, no kDNA. Scale bar, 5 μM.

