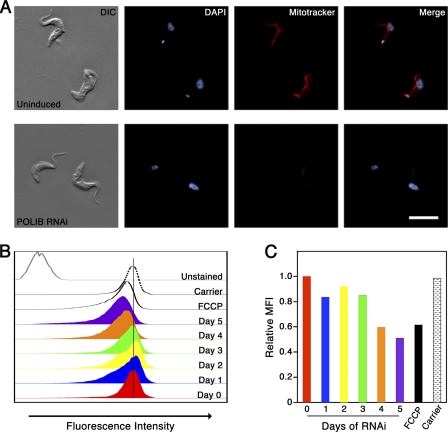
Fig. 6.
Disruption of mitochondrial membrane potential during DNA polymerase silencing. (A) Representative images of MitoTracker Red-stained parasites that were either uninduced or induced for 4 days of POLIB RNAi. (B, C) Flow cytometry analysis of MitoTracker Red-stained parasites. Unstained control, parasites treated with DMSO (used as a solvent for MitoTracker solutions); FCCP, protonophore used as a negative control; carrier, parasites treated with ethanol (used as a carrier for FCCP). (B) Histogram showing fluorescence intensities of indicated samples. (C) Relative mean fluorescence intensities (MFI) of parasites presented in panel B. The unstained background was subtracted from raw MFI values prior to graphing the adjusted MFI relative to that of uninduced cells.

