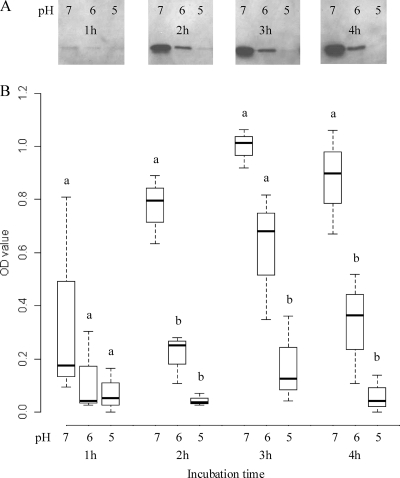
Fig. 4.
Differences in beta2 toxin production by C. perfringens strain Cp15 in MRS broth with an initial pH of 7, 6, or 5 after 1, 2, 3, or 4 h of incubation. (A) Western blot assay of a single experiment. (B) Mean optical density (OD) values of the various bands of three independent experiments as quantified by densitometry. A different letter indicates a significant difference (P < 0.05) in the mean toxin levels at the pH levels and times indicated.

