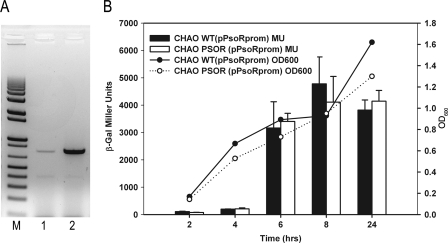
Fig. 1.
Determination of psoR expression levels. (A) Lanes: M, 1 kb + DNA ladder (Invitrogen); 1, RT-PCR product obtained for CHA0(pBBRMCS-5); 2, RT-PCR product obtained for CHA0(pBBRPsoR). (B) β-Galactosidase assays showing the expression profile of psoR in P. fluorescens CHA0 wild type and its psoR mutant CHA0PSOR, both harboring a psoR–lacZ reporter fusion. The graph was plotted using SigmaPlot version 10.0. β-Gal, β-galactosidase; OD600, optical density at 600 nm; MU, Miller units.

