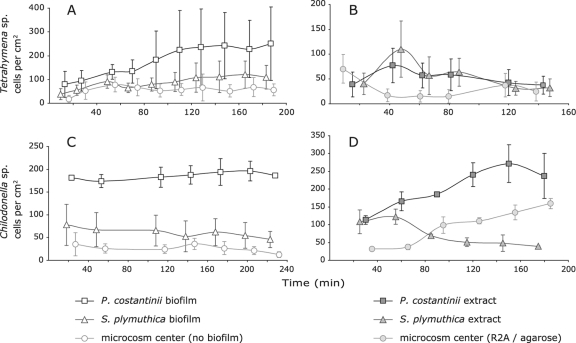
Fig. 3.
Distribution of Tetrahymena sp. cells in microcosms (type 1) containing spatially separated P. costantinii and S. plymuthica biofilms (A) or bacterial cell extracts (B) and distribution of Chilodonella sp. cells in microcosms (type 2) containing biofilms (C) or bacterial cell extracts (D). Cell counts were made by direct microscopic observations and video recordings. Counts of Chilodonella sp. cells were not made until after sufficient time had elapsed to allow cells added in suspension to settle. Each data point is the mean number of counts at nine different locations on each biofilm (for Tetrahymena sp. experiments) or three separate replicates (for Chilodonella sp. experiments). Error bars represent ± one standard deviation.

