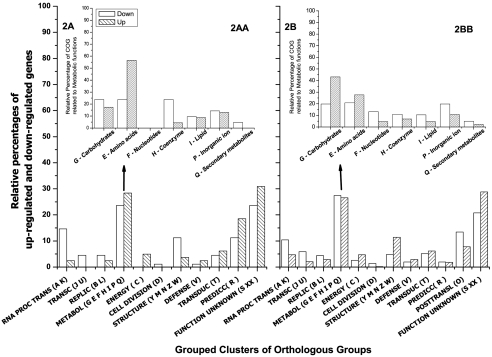
Fig. 2.
Transcriptional response of C. acetobutylicum ATCC 824 after the cells were challenged with 50 mM butanol. The bar graphs denote significantly upregulated and downregulated genes as percentages of the total number of responsive genes. Significant responsive genes were grouped into functional categories (Clusters of Orthologous Groups [COGs] [www.ncbi.nlm.nih.gov/COG/grace/uni.html]) after the normalized series were analyzed by short-time-course microarray (44) and mixed-model analysis (14). (A) Frequencies of genes showing a significant kinetic linear pattern (time course microarray series 10, 30, 45, 60, 120, 360, 720, and 1,440 min) compared to genes that show a flat pattern (no regulation); (AA) percentages of genes that belong only to the metabolic grouped category (COG groups G, E, F, H, I, P, and Q) found in panel A; (B) frequencies of genes showing a significant responsive after mixed-model analysis [time × treatment = (360 min butanol) − (360 min control)]; (BB) percentages of genes that belong only to the metabolic grouped category (COG groups G, E, F, H, I, P, and Q) found in panel B.

