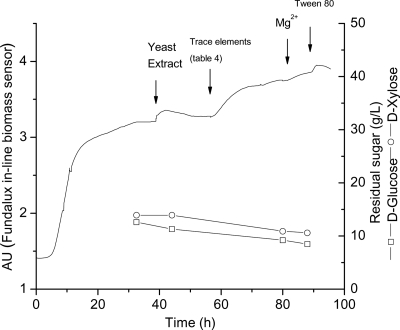
Fig. 3.
Pulse-and-shift technique applied to C. beijerinckii SA-1/ATCC 35702 culture in a chemostat (dilution rate [D] = 0.135 h−1) at 37°C. Time (in hours) versus d-glucose or d-xylose consumed (g/liter) and biomass (in arbitrary units [AU]) are depicted on the graph. The pulse location for each component that was added is indicated on the graph by arrows (↓). Each compound was tested individually by adding to the consolidated medium reservoir (pulse) (Table 3). Once an ingredient limitation was satisfied, an increase in sugar utilization followed by a transient increase in biomass (responses) was observed, and the compounds showing a positive response were added to the medium reservoir (shift) before the next component was tested. A steady state was reestablished before each new element was added and evaluated. Each compound was added to the reactor at the following final concentrations; yeast extract (2 g/liter), trace elements (double the concentration added to the original medium [see Table 4]), MgSO4 (0.1 g/liter), and Tween 80 (1 ml/liter).

