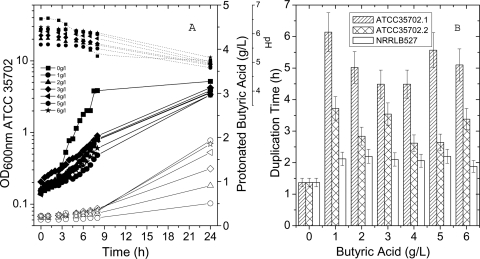
Fig. 4.
(A) Growth kinetics of C. beijerinckii SA-1/ATCC 35702 exposed to increasing concentrations of butyric acid. Each flask contained identical initial concentrations of undissociated butyric acid. Symbols connected with dotted lines show pH evolution, symbols connected with solid lines show growth of the SA-1/ATCC 35702 cells, and open symbols with solid lines show the amount of undissociated butyric acid in each flask. The growth curves for strain SA-1/ATCC 35702 are biphasic. (B) Comparison of duplication times of C. beijerinckii (NRRL B-527) and C. beijerinckii (SA-1/ATCC 35702) challenged with increasing butyric acid concentrations. The duplication times of both slopes for SA-1/ATCC 35702 are labeled ATCC 35702.1 and ATCC 35702.2.

