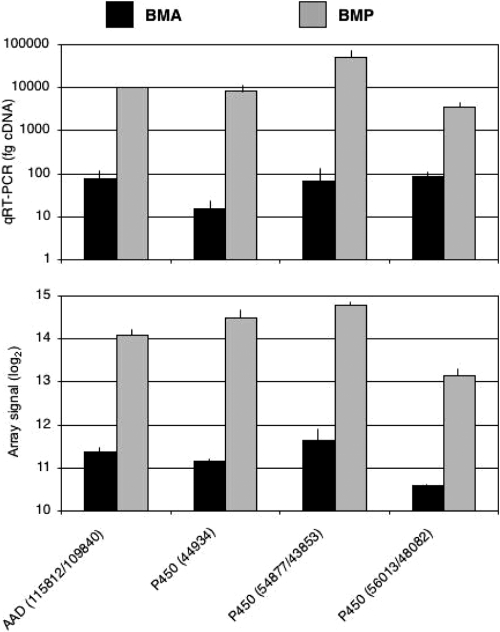
Fig. 3.
Transcript levels of P. placenta genes encoding cytochrome P450s and aryl alcohol dehydrogenase. Protein model numbers are shown in parentheses, with slashes separating allelic variants. The upper panel indicates amounts of cDNA determined by competitive RT-PCR, whereas the lower panel shows log2 microarray signals. Black and gray bars represent results for triplicate BMA and BMP cultures, respectively. PCR primers are listed in Table S1 in the supplemental material.

