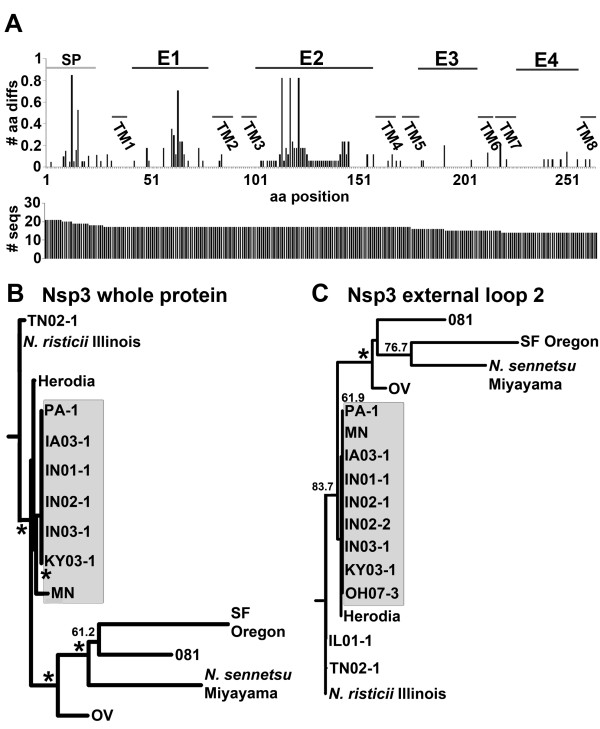
Figure 5.
Nsp3 amino acid sequence variations. (A) Amino acids different from N. risticii Illinois, including insertions and deletions are divided by the number of sequences plotted for each amino acid position (# aa diffs). The horizontal axis displays Nsp3 amino acid positions (aa position) including the signal peptide and all detected amino acid insertions (264 aa total). SP, signal peptide. E, external loop; and TM, transmembrane domain are based on the predicted secondary structure. The number of sequences available at each amino acid position on Nsp3 (# seqs) is shown below. (B) Dendrograms of Nsp3 from the full-length protein, including the signal peptide (14 sequences total) and (C) the predicted external loop 2 (57 aa, including all insertions; 17 sequences total) are shown with bootstrap values greater than 50.0% for 1000 replicates. *, bootstrap value of 90.0% or greater. Post-2000 sequences are shown in the shaded area. GenBank accession numbers of new sequences are listed in Table 1.

