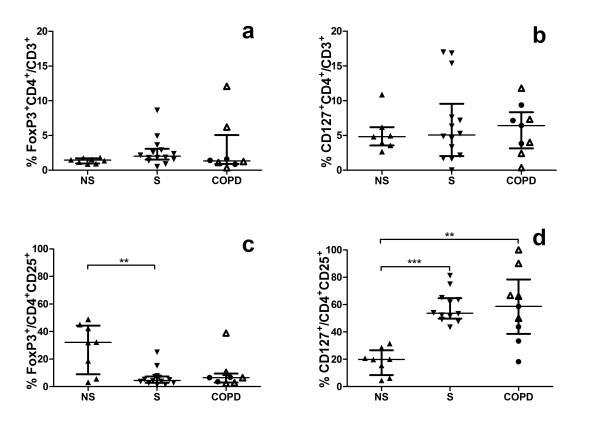
Figure 3.
Flow cytometry analyses of BAL T cells from never-smokers (NS), smokers with normal lung function (S) and COPD subjects. The proportion of CD4+ T cells expressing FoxP3 (a) or CD127 (b) are given as percent of total T cells (CD3+). Percentage of FoxP3+ (c) or CD127+ (d) among CD4+ T cells expressing CD25. The CD127+ population includes the CD127dim cells. Within the COPD group, ● indicates ex-smokers and Δ smokers. Significance levels are noted as ** p < 0.01 and *** p < 0.001. COPD smokers have increased proportions CD127/CD25 among CD4+ cells compared to COPD ex-smokers (p = 0.027) and to never-smokers (p = 0.003). Data are given as median and IQR.

